In the current version of VANE Language, we use images from Landsat8 satellite which captures the Earth’s entire surface every 16 days. The satellite makes hundreds of images with a unique name for each one like LC81410552016219LGN00 and a pixel size of 30 meters, each image consists of 11 bands, the size of the uncompressed image is 2 GB.
Landsat 8 Operational Land Imager (OLI) and Thermal Infrared Sensor (TIRS)
images consist of nine spectral bands with a spatial resolution of 30
meters for Bands 1 to 7 and 9. New Band 1 (ultra-blue) is useful for
coastal and aerosol studies, and also new Band 9 is applicable for
cirrus cloud detection. The resolution of Band 8 (panchromatic) is 15
meters. Thermal Bands 10 and 11 provide more accurate surface
temperatures and are collected at 100 meters. Approximate scene size is
170 km north-south by 183 km east-west (106 mi by 114 mi).
By default, we get B2, B3, B4, B5, B7, but it is possible to download any other bands.
By default, we get B2, B3, B4, B5, B7, but it is possible to download any other bands.
Landsat 8 Operational Land Imager (OLI) and Thermal Infrared Sensor (TIRS) Launched February 11, 2013
Band
1 — Coastal aerosol, Band 2 — Blue, Band 3 — Green, Band 4 — Red, Band
5 — Near Infrared (NIR), Band 6 — SWIR, Band 7 — SWIR, Band
8 — Panchromatic, Band 9 — Cirrus, Band 10 — Thermal Infrared (TIRS),
Band 11 — Thermal Infrared (TIRS)
Let’s consider how these bands and their combinations can be used to visualize Landsat 8 images.
Bands 2, 3, and 4
Blue, green and red spectra combine together for creation of full color images.
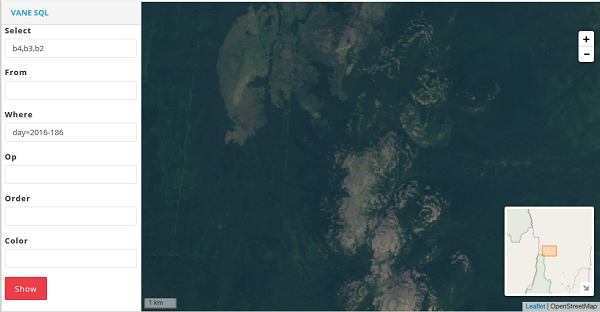
One of the simplest operations is to generate RGB map. Here an image consists of Bands 4–3–2 which correspond to the well-known RGB color model.
One of the simplest operations is to generate RGB map. Here an image consists of Bands 4–3–2 which correspond to the well-known RGB color model.
image #1
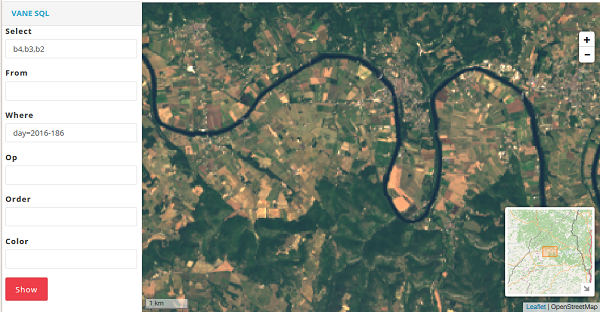
France, a spot near Toulous.
image #2
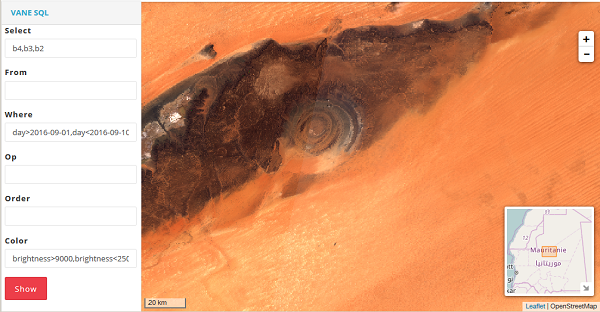
The Sahara desert.
Band 5
Near
Infrared (NIR) — this part of the spectrum is one of the most
frequently used as healthy plants reflect it mostly: water in their
leaves scatters the wavelengths back into the sky. This information gets
useful for vegetation analysis. By matching this band with others, one
can get indexes like NDVI, which provide more precise measurement of
plant condition comparing with only looking at visible greenness.
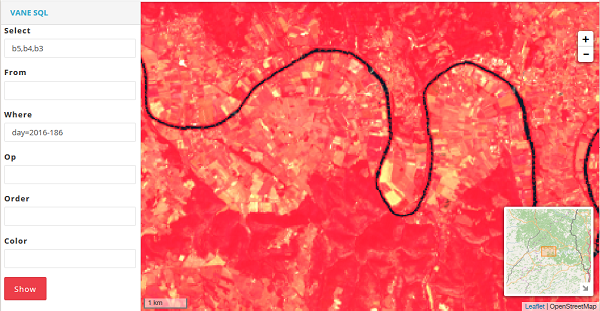
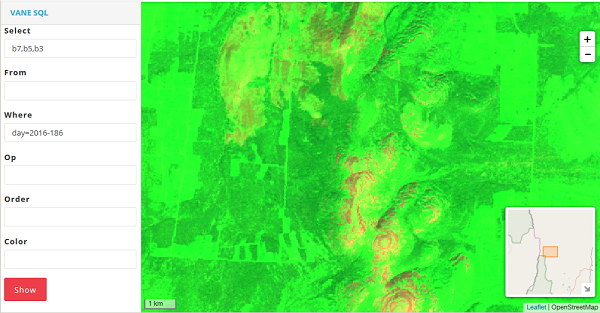
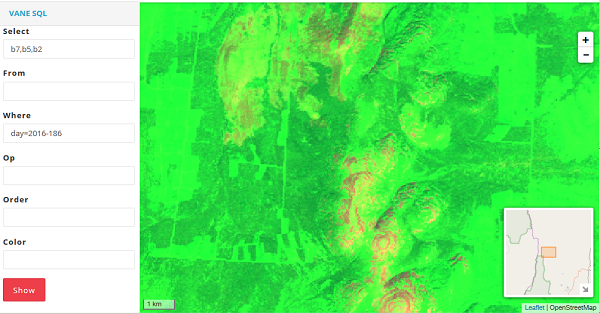
Let’s look at image #1 in the 5–4–3 band combination.
5, 4, 3 — Traditional Color Infrared (CIR) Image
Pay
your attention how healthier vegetation beams in red more clearly. This
band combination is often used for remote sensing of agricultural,
forest and wetlands.
Bands 7 — The Shortwave Infrared (SWIR2)
Spectra
Shortwave Infrared let clearly distinguish wet soil from dry one, and
also differentiate the earth’s structure: rocks and soils that can look
almost similar in other bands have strong distinction in SWIR.
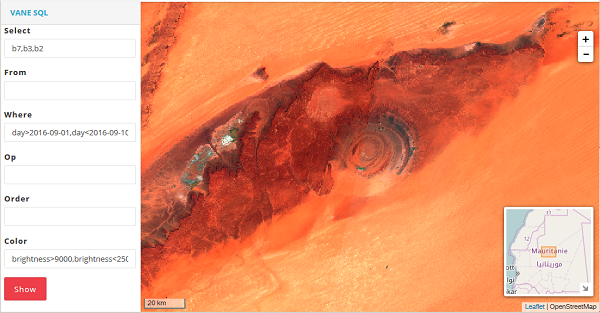
We get the following picture if we take image #2 and use infrared band 7 instead of red band 4.
7, 5, 2 — False color image
This
band combination is convenient for the monitoring of agricultural crops
which are displayed in bright green color. Bare earth is showed in
purple color while not cultivated vegetation appears in subtle green.
Compare the image made in essential RGB colors:
And here is the 7–5–2 band combination:
7, 5, 3 — False color image
This
false color image shows land in orange and green colors, ice is
depicted in beaming purple, and water appears to be blue. This band
combination is similar to the 7–5–2 band combination, but the former
shows vegetation in more bright shades of green.