The traditional market of satellite imagery products is something not easy to communicate with. You have to deeply immerse yourself in the subject of geospatial and remote sensing to realize what kind of products you could get and how it could be used in your particular application. Besides Google Maps and this kind of horizontal platforms, where the satellite images are a part of the map services, there are financial and technological barriers that hold back the market of satellite imagery products being accepted by mass market applications and services developers.
When the satellite market is growing due to a microsatellite technical revolution and appearance of the new private companies (over 1.500 satellites are expected to be launched before 2024), we see more open data, like ESA’s Copernicus program, became available — the cost barriers are going to be less challenging. The goal of VANE™ platform is to remove the technological barriers for application developers and education.
VANE Query Language for intuitive queries to the data, getting it instantly into application
The SQL fashioned VANE Language concept is to unite all operations with satellite data, like processing and delivery, in one single query.
The typical workflow for satellite product — which means the one for appropriate location and data period — looks like the following:
- go to a catalog of satellite imagery (for free and publicly available Landsat imagery, one is https://earthexplorer.usgs.gov/, povided by US geological survey)
- search by predefined criteria manually or through the API, if provided, in order to get the imagery list (the number of scene ID’s) and the metadata
- download so called Level1 products (in terms of pre-processing, usually in GeoTiff format) by selected ID’s
NB! Concerning Landsat — after Amazon launched their Landsat on AWS, it’s become more usable to download products by specific bands. At “Openweathermap” we also use Amazon cloud services but as one of the data sources to download Landsat data - then you come to data processing either it’s a simple RGB synthesis or an operation to calculate some values like NDVI (vegetation index). Typically for that kind of tasks the data processing software is necessary — usually representing the powerful packages that are superfluous for such kind of operations (not to say too expensive)
- finalize your workflow by preparing your products for Web — which means transformation into Mercator projection, tiling and uploading to some web server or deploying your products using one of commercial or opensource geo servers software through WMS / TMS export protocols
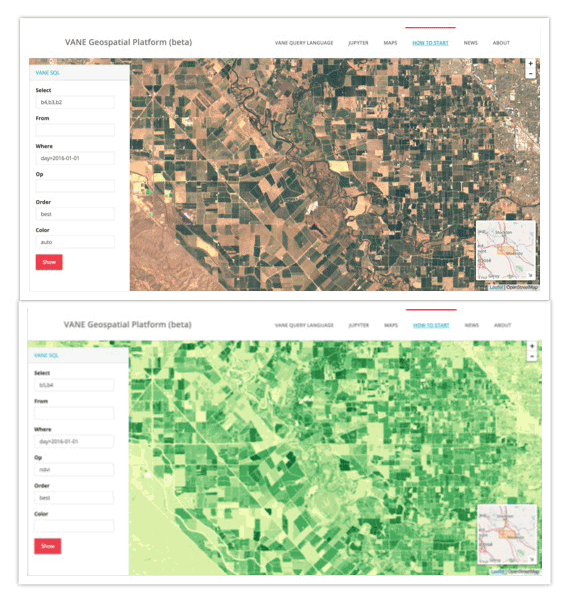
In VANE Language the workflow mentioned above might look somehow like this:
http://{s}.sat.owm.io/sql/{z}/{x}/{y}?select=b4,b3,b2&where=day>2016-01-01&order=best&color=auto
Moreover you can build queries and check them online getting instant visual result with the help of VANE visual tools like SQL-viewer.
What does it promise for now (or for the near future)?
No catalogs:
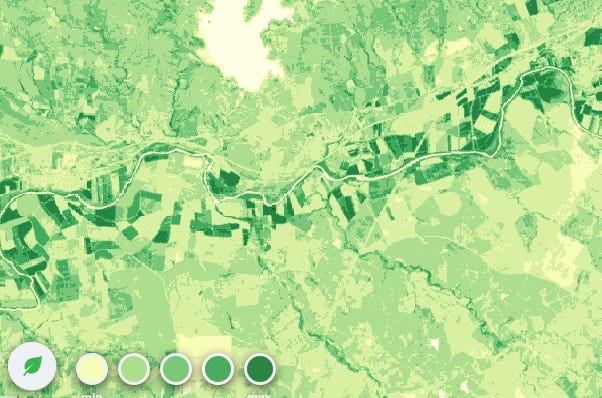
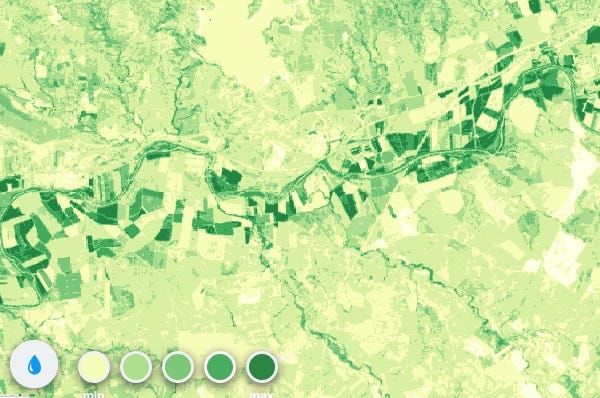
The one of the ideas of the VANE platform — no need of search by scenes and footprints. It is based on a simple assumption: each location in the world has metadata — click on any location and get information about all pixels containing this location. Such projects as cloudless atlases and Google base satellite maps are created according to this basic principle, stitching best imagery pixels in one seamless mosaic. According to scenes metadata VANE can preliminary compile the best satellite cover — users need to set up a parameter order=best for this operation. Even more, VANE language allows you to set up further requirements for your mosaic, providing appropriate parameters in your query — meaning: no older than (day>{yyyy-mm-dd})… or put all last imagery on the top (order=last)… or within the specific time interval (between({yyyy-mm-dd}:{yyyy-mm-dd}))…
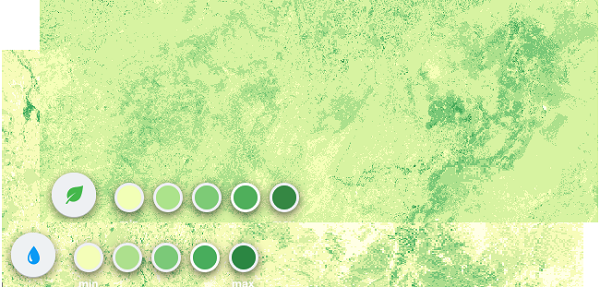
Than you can go further, applying your custom colors to the result mosaic, according to VANE language specification.
No desktop:
Although for deep analysis of satellite images and processing it for expert work, like seamless and tonal-balanced satellite mosaic or training algorithms for change detection, you do need some software and packages, yet most of the typical tasks and algorithms you can apply online. And this is the trend of BigData and SaaS that could hardly being stopped by GIS software vendors.
One query:
With the VANE query language developer sets up all parameters in one query:
- what kind of data he needs (satellite imagery, weather, sensors)
- applied processing methods (RGB, NDVI, false colors; any other indices, band combination, custom color scheme etc.)
- <a result format> (map, tile, JSON data feed etc.)
VANE analytical tools for online computing and data processing
For such kind of applications and exercises we’ve deployed JUPYTER programming environment with the VANE language implementation.
Jupyter Notebook is a popular open and free tool on Python that combines code, text, and charts, and provides you with the possibility to distribute results to other users. With Jupyter you can play with VANE data such as weather and satellite images and their combination. It is an ultimately convenient tool for data science, experiments with math algorithms and data processing. And of course for education.
Jupyter Notebook is a popular open and free tool on Python that combines code, text, and charts, and provides you with the possibility to distribute results to other users. With Jupyter you can play with VANE data such as weather and satellite images and their combination. It is an ultimately convenient tool for data science, experiments with math algorithms and data processing. And of course for education.
Now we can get closer to analytical tasks like change detection — one of the very base for analysis on satellite imagery. This particular example shows how to apply Normalized Burn Ratio Index (NBR) to Landsat to detect wildfire burning footprint for the chosen area.
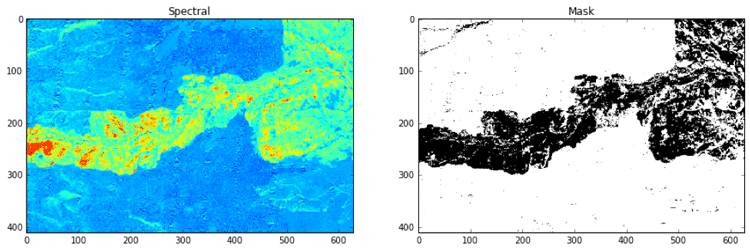
As a result of the exercise you will get a calculated area of burnt land as a resulting difference between two images.
Launching Jupyter on VANE platform under your Openweathermap account you will find all examples in the subdirectory and will be able to create your notebooks for experimental and research tasks with the immediate results that you can later download as a ready-to-publish material or share with your colleagues.