пятница, 12 августа 2016 г.

Use of satellite technology for decreasing risks in agriculture

The exploration of outer space and launching of satellites started in the 1960s. Having some romantic flair in the beginning, the satellite story went on and nowadays satellites are launched often and almost everywhere around the globe and their number is going to grow in the future. Together with that, a new question arose, what to do with a bunch of new information received? A huge lot of information has been gained in the satellite era, but its practical appliance can be seen only in certain spheres of economics.

One of the spheres where data received from satellites are used effectively is agriculture. There is a range of agricultural problems which can be solved with the help of these data. Satellites are classified into ones of high resolution, of medium and of small. Basically for agriculture satellites of medium resolution of 5–250m per pixel are used. What can be seen in such satellite images and what tasks can be done with the help of satellite data?
 
Garden City, Kansas

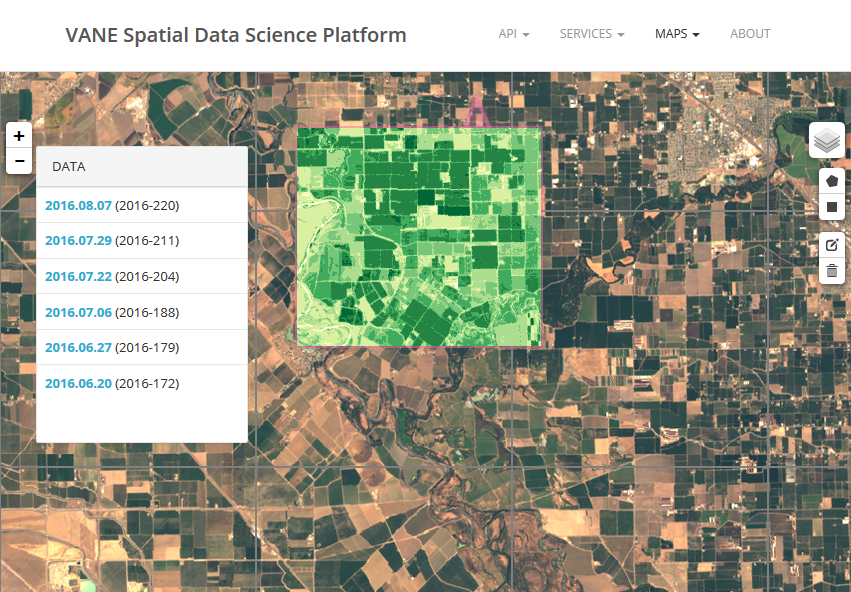
Using satellite data one can judge about the level of cultivation of soil in specified area, identify actively cultivated and abandoned fields and define their configuration. Also with the help of satellite data it’s possible to get information about the current state of things without visiting a specific field. Analysis of satellite data allows understanding whether agricultural events are properly conducted, whether the technologies of cultivation are not violated, and whether soil requires additional treatment for enhancing fertility. With satellite images it’s possible to evaluate condition of agricultural plants; the normalized difference vegetation index (NDVI) is designed for that. The normalized difference vegetation index is a simple graphical indicator of biomass active photosynthetically that is calculated via several spectral channels. Satellite possesses from 10 to 30 spectral channels. Any satellite has its own set of channels which can be visible, infrared, ultraviolet, thermal, etc. Satellites measure the reflectance of the planet in many spectral resolutions as Earth looks different in various spectral resolutions. Plants reflect light well in one spectrum while plants do absorb it in another spectrum. Correlation of these indicators allows defining live green plants from other objects. The NDVI is one of the most well-known and used index to detect live green plant canopies and to evaluate vegetated areas, their condition and quality.

Let’s see what tasks can be performed with the NDVI.
Monitoring of crop emergence.
Real-time monitoring allows supervising the current situation and forecasting crop yields. Using the NDVI it is possible to detect presence of plants, its dynamics of emergence and growth. Maps of the NDVI with dynamics (various seasons) let tracing peculiar features of seasonal vegetation, its deviations, allow planning, etc. For instance, knowing weather forecast, condition of plants and considering the current date, forecast about the amount of yield in the current year can be made. However, a specific feature of satellite monitoring should be taken in to consideration: satellite technology works for global tasks only, this technology is pointless for small farms. Small local farms do not need satellite technologies in their everyday operations. But this kind of information can be of great importance for wholesale purchasing companies. In this case information about extensive regions is of big interest: what region is more fertile, what plants grow widely and where wholesale can be done.
Field of green onion. Colombia, Aquitania

 Analysis of historical data.
Historical data is information on the cultivation of fields, evaluation of their productivity and the efficiency of the technologies used. Currently a large archive on a daily survey of earth surface is gained. For example, satellites of MODIS system orbit earth on a daily basis since 2000.
 In this archive history on any field cultivation for the last 15 years can be obtained. This is a great opportunity for insurance companies to receive information about a future customer and to decrease potential risks.
NDVI maps


Accurate land tenure.
Nowadays global manufacturers of fertilizers provide quite complex products. These are not only fertilizers simply, but also compound technologic processes for specific kind of plants, for peculiar weather conditions. Basically, a half of the cost of maintaining crop comes to expenses on fertilizers, and issue of proper use of fertilizers is an actual task for farmers. Evaluation of field condition based on satellite, weather and historical data is an available remote tool for analyzing the efficiency of land tenure, which lets significantly reduce commercial risks and expenses on fertilizers.
Evaluation of efficiency of water reclamation systems.
Condition of irrigation and drainage systems, their violation and failures can be estimated by comparative productivity of specific kinds of agricultural plants.
Evaluation of pastures and hunting grounds.
The NDVI allows effectively and at a low cost solving such tasks as assessment of quality of hunting grounds and of pasture productivity for planning of their usage and detecting violations of cattle grazing.

среда, 10 августа 2016 г.

Mitigating of weather risk makes “the weather excuse” invalid

It is hard to overestimate the impact of the weather on human lives. The weather affects how we feel, what we eat and wear, where we plan travelling to — actually it has its impact on all human activities. This is true not only for aspects of everyday life but also for various sectors of the economy and industry. Any industry is subjected to weather risk to some extent.

Every time when devastating weather phenomena take place many companies gets hurt, there are among them property and casualty insurers, construction firms, real estate developers and shipping companies. It is also an essential issue for energy, oil and gas concerns, agriculture enterprises, ski resorts and many other companies from different spheres.

During many decades, “the weather excuse” was enough to explain poor financial results. In the face of global changing of climate the weather starts playing more and more important role in operational performance of companies, and nowadays there do exist technologies and tools to mitigate weather risk significantly, and thus to make “the weather excuse” groundless.

Steady ability to manage weather risk lets companies reduce direct financial losses and gives instruments to better execution of fiduciary duties to shareholders. Certainly a complex approach to detection and management of substantial business risks should include weather risk management.

среда, 3 августа 2016 г.

Uncontrolled weather and controlled weather risks

Weather is changing and will continue to constantly, it cannot be stopped and there is nothing to do about it. Weather activities happening in the past few years speak for themselves: tornado in the southeast of the United States at winter time, unusual droughts, and exceptional outbreaks of extremely cold arctic weather in the northern part of the country.

Such weather phenomena as prolonged drought in California or heavy rainfalls that struck the southeast of Texas 6 months ago can turn into a real disaster for both the population and the economics of many states. It is worth mentioning that fluctuations in expected weather conditions represent growing risks for financial well-being of enterprises conducting business in various spheres of economics and these weather changes violate revenue flow potentionally. It goes without saying that these companies are interested in decreasing of the risks.

There is no way to affect weather, but nowadays there exist technologies (Big data, IoT), methods of data collection and data analysis and other new solutions that allow to diminish weather risks for different business scales, from large companies to individual farmers.

понедельник, 25 июля 2016 г.

The role of agrosystems in air pollution: satellite technologies suggest a solution


Recently the issue of environmental pollution and of its consequence such as global warming has been highly discussed at different levels from mass media to heads of governments. United Nations conference on climate change which took place in Dec, 2015 in Paris, France obliged countries that use hydrocarbon fuels to decrease emission of greenhouse gases to the atmosphere, and this fact correlates with world economics looking toward implementation of use of renewable fuels. However this process is unacceptable and almost impossible for many countries at the moment. It goes without saying for such countries as Saudi Arabia, Venezuela and India, and even in the USA this decision of the Paris climate summit found its opponents. The denial of vital questions of climate change and global warming is similar to practice of "burying the heads in the sand." These issues do exist and take their toll on world economy not in the best way.

But why are those who are actively concerned about environmental pollution so entirely focused on the issue of hydrocarbon fuels? One can say that emission of greenhouse gases to the atmosphere is only one of several global factors. You would not guess but such sphere of economics as agriculture affects negatively environmental pollution also. In its turn it is agriculture that primarily experiences losses from the effects of climate change. Exceptional weather phenomena (e.g. droughts and heat waves) are often related with air pollution, and all that causes drastic losses of productivity in agriculture. Food safety is the key issue for the society in this century.

According to modern researches, evaporation of fertilizers and animal waste which are rich in nitrogen combines in the air with emissions from fuel combustion and thus aerosols are formed, which can be a major factor of illness and death. These aerosols surpass all other human sources of pollution of fine-grained air on majority of the territories of the USA, Europe, Russia and China. Eventually the excess of fertilizers comes into streams and rivers. Agricultural pollution comes to the atmosphere mainly in the form of ammonia which is released into the air as gas from excessively fertilized fields and animal waste. Then this compound mixes with pollutants from combustion which are generally nitrogen oxides and sulfates oxides produced by vehicles, power plants and industrial processes. Aerosols can penetrate deeply into lungs of living creatures, causing heart or lung disease. The prospects of transition of world energetics to renewable energy sources can seem more than vague, but the control of amount of used fertilizers without affecting crop productivity is more than real. Nowadays the use of fertilizers is a technological process which is far ahead from principle of “the more you fertilize, the more crop you get”. Technologies of fertilizing are designed for each specific agricultural plant, for original weather conditions in a region, for different stages of plant growth, for actual weather, for presence of pests, etc. For proper use of technologies of fertilizing there exist powerful analysis tools providing feedback and accurate evaluation of efficiency of the use of fertilizers on each field. Analysis of weather data allows evaluation and forecast of such characteristics as humidity, precipitation, solar radiation (UV-index).

With the help of satellite communications it is possible to estimate condition of fields, plant growth rate (NDVI-index), while weather history serves to get to know reasons of what is happening. At the moment there are products that let farmers control 100ha fields remotely. Thus modern technologies are here not only to relieve farmers’ work, but also to provide proper control over fertilizers used and by this to decrease environmental pollution.

среда, 20 июля 2016 г.

Impact of climate change on agriculture: problems and their solutions


It is not news nowadays that the climate on earth is changing. And this change is not a long-term prospect, this is a process happening here and now. Consequences of it one can observe in this day and age. Climate change has a global impact on the human environment, nature, wildlife. And surely it also takes its strongest toll on economics. The most vulnerable to climate change agricultural sector turns to be. Many agricultural plants, on manufacture and market sale of which economics of some countries and large sectors of world trade are based, are extremely susceptible to weather changes; unexpected climate changes, not to mention here a process of global warming, can affect production of these plants in the most disastrous way. In its turn this process can directly influence the majority of population of export countries, where cultivation of these plants is basically the only source of income, and in some cases the main element of the food supply. Kenya where about 9% of the world leafy tea are produced and this tea is the largest source of foreign currency for the country faces the situation when more abundant rainfall, severe drought and unexpected frost damage fragile bushes. In consequence, tea plantations are reduced, and to maintain export level of tea it is necessary to start locating new plantations at higher altitudes. This case makes farmers’ work complicated, and many of them can lose their livelihood.  
A rise in temperature, frequent droughts and heat waves reduce the growth period of cassava (Manihot esculenta) on African fields that accordingly affects the crop adversely. Considering that cassava is a staple food in this overpopulated region threat of famine seems quite real.
 “In the case of the US drought, soybean production decreased by 12%, while core production fell by 13% to its lowest level since 2006, according to the Department of Agriculture. Insured crop losses were almost $12bn and overall GDP suffered as a result. Credit rating agency Standard & Poor’s has predicted that weather events like extensive droughts or high temperatures will have a negative impact on credit ratings of corporations and institutions that are affected.”
(с) Allianz Global Corporate & Specialty
Due to frost in Brazil, millions of tons of sugarcane were damaged, which led to a significant reduction in sugar exports. Reuters informs that frosts also would lead to considerable losses of wheat crop in the current season and of coffee crop next year.
Thus one of the most important questions related to climate change including global warming is how it will affect the food supply of the world population which keeps growing.
Humanity can influence climate change only to some small extent. And even if a battle with global warming is successful, the climate on earth still will keep changing. Impact of such phenomena as El Niño is hardly underestimated.
And also one should pay respect to rainfalls, drought or frost, which are temporary, but sometimes protracted.  
Currently a whole package of measures is suggested which can if not change the situation then smooth out the impact and consequences of various weather phenomena on economics in general and on agriculture in particular. For instance, increasing of efficiency of agricultural measures, so-called “current land use” is worth mentioning here. Nowadays these technologies exist which help making choices in how much land to cultivate, how many and what kind of crops to plant in some region and what the best use for fertilizers is in a condition of changing climate.
Here come to help weather forecasts specially designed for agriculture, analysis of historical data, processing of satellite images in various spectrums, etc. A new sector of economics called the weather risk management market highly develops.
Public
attitude to insurance in agricultural sphere has been changed. The standard common approach gives its way to thoughtful, based on analysis of all available data one, to insurance of farmers, which can help them survive crises caused by natural disasters.
And there is a hope that the use of cloud and big data technologies, the use of platforms such as VANE Spatial Data SciencePlatform by OpenWeatherMap if not tame weather phenomena, then make them a calculated object for forecast and analysis.

понедельник, 11 июля 2016 г.

Unity of satellite and weather data to battle fires

Meanwhile space dimension technologies highly evolve and artificial space satellites explore other planets for decades already, satellite technologies for observing the surface of our planet also become more complicated. With analysis of data received from satellites one can if not solve entirely then as minimum contribute to solving of global issues in many aspects of human life such as agriculture, logistics on ground surface and in open water, environmental pollution, etc.
And one of such global issues which has become extremely crucial during recent months is afire. It happens in both hemispheres of the earth: in California, Arizona, Ontario, at Baikal Lake. Surely the main battle with fire takes place on earth surface, however such technologies as remote monitoring and other tools which provide timely data can and already do make performing of work tasks for firefighters easier. Generally speaking, unity of field maps and remote monitoring is a modern standard for fire guiding services. So how can remote monitoring help in battle with fires? The main questions that are of great importance in the beginning are whether there is a real fire or not, the amount of victimized territory, how much stuff have already burnt and how much can be burnt in the future. At this stage timely and proper operational data are crucial since these data are used in calculating how many human and technological resources are necessary to battle fire. So how can satellite data help then, and what can be calculated with its help? Nowadays there are several methods of detection of fires. All the satellites have infrared sensors, and open fires are well seen in infrared dimension as they beam as bright red points in this spectrum. Thus with the help of satellite monitoring any deviance is traced which likely can turn to be a fire. Unfortunately if a starting fire is small in size then it can’t be detected on images from satellites.
One more problematic aspect here is that one cannot definitely say that it is a fire for sure on an image, as a factory pipe or a roof highly heated under sun can also glow brightly in infrared spectrum. That is why the process of interpretation of these data is rather complicated and however there are such products as Fire Information for Resource Management System (FIRMS)by NASA, this question of interpretation of data is not completely solved yet. The second issue here is that a satellite is a little help in detection of unseen fire. It happens when peatbogs burn. If a latent fire is covered with leaves or peat burns under the surface of the ground, then such fires are hardly seen in infrared spectrum.
But in case when a fire affects big territories of hundreds of hectares, it is properly to speak about accurate evaluation of a situation with the help of satellite data. And in a situation when thousands of hectares are affected the remote monitoring provides the better perception of a case in comparison with ground research or a flight over a fire as there are risks of poor visibility, smoke and lack of fuel. Also satellite can help to detect the areas where smoke spreads. Smoke consists of aerosol particles and thus it can be easily differentiated from clouds, but not so easily from greenhouse gases coming with wind from neighboring fields. Summarizing it all, it becomes clear that at least at a current stage of technological progress the problems of timely fire detection and of getting accurate data about existing fires cannot be entirely solved using only satellite technologies. And here weather data come to help.
Combined analysis of satellite and weather data contributes to more complex and precise products. One can perform forecasting of behavior of points with starting fire: whether a fire is going to a halt or whether more territory can be affected. For instance, analysis of NDVI index provides knowledge that it is exactly wood burns. Further one can determine a degree of humidity and find out that this wood is dry, in a case. By analyzing available historical weather data it is possible to get to know that it has not rained recently, thus at the moment this forest is quite arid. Or vise versa, it has rained recently, air humidity is high and thus one can come to a conclusion that a fire will not last long. With forecasts for a specific location one can determine whether a storm with lightning is expected, as lightning on its own can cause fire and boost burning in a dry forest. Also forecasts show whether heavy rains and showers are possible during next 2 weeks, which can stop fire.
Therefore, there are several factors for analysis: the presence/absence of forest, the amount of fresh and dry leaves, humidity, forecast expectation of rains and storms. Considering these and other data a conclusion can be made whether the given territory is at risk or not for the next 2 weeks.
Later on, with knowledge of wind direction it is possible to predict spreading of fire and smoke, to determine presence of towns and settlements in affected areas, and to define degree and time frames of approaching danger and to warn inhabitants.
Unfortunately in cases when smoke covers large cities there is a little chance to battle fire with human-made tools. Authorities can try to stop fire spreading, can provide people with respirators, can involve air conditioners, can engage humanitarian aid. But only weather condition with heavy rains is in force to bring fire to a halt. Thus timely detection of fires, elimination of it at stages when it is possible to do or at least not using heavy machinery is important not only for firefighters who work on the ground, but also for inhabitants who live in potentially dangerous areas.

пятница, 8 июля 2016 г.

Big Data and analytical systems. Data on air pollution for exact forecasts

Smog 1n Mexico DF
In recent years, the situation with air pollution is becoming more alarming and attracted the attention of leading media and politicians at the highest level. This is especially true of large cities such as Beijing, Los Angeles, Mexico City, Tehran, Johannesburg and other densely populated settlements, which are under the influence of various risk factors, such as dense traffic, the presence of air polluting enterprises located poorly in terms of ecology, where pollution levels sometimes exceed all standards many times.

Depending on the degree of interest of the authorities in cities, pollution control is more or less in place, but, unfortunately, the monitoring systems which are in use now, are ineffective. Technologies that allow to build forecasts already exist, but they do not provide the necessary level of accuracy and do not allow to predict rises to a dangerous levels of pollution. The basis for the creation of accurate predictions certainly are accurate data on key parameters in an amount, that is sufficient for analysis.
OpenWeatherMap provides unencrypted API data on basic parameters such as carbon CO2, ozone O3, nitrogen dioxide NO2 and sulfur dioxide S02, as well as data on the contents in the air of fine particles AOD (Aerosol optical depth), which are extremely dangerous for human health. OpenWeatherMap processes massive amounts of accurate data that can be processed for any geo point in the world. This data is obtained from tens of thousands of sensors worldwide from satellites and monitoring systems. On the basis of such data, using modern technology, such as the Internet of Things (IoT) and Big Data has now become possible to build the analytical system, capable of delivering high-precision forecasts for maximum contaminant levels for a few days in advance. With these forecasts, experts can formulate recommendations, and local authorities are able to take measures to reduce pollution, such as the optimization of the traffic, movement of industrial facilities outside the city, planting of forests and the creating green parks at key locations in major cities, the use of alternative sources energy. Similar measures have already been shown to be effective in some countries — in the UK (London) and in Japan (Tokyo).
OpenWeatherMap provides API to the historical data, as long as to the data obtained as a result of monitoring in real time, which allows a visual comparison, including the virtualized format and helps to identify the sources and periods of maximum and minimum levels of pollution, their possible recurrence, estimate the effectiveness of measures taken to combat the pollution and to understand the weaknesses of the monitoring infrastructure in the big cities.
With the help of a joint analysis of pollution data, historical and current weather and satellite data provided by OpenWeatherMap, one can find the cause of environmental degradation in any region or a particular village — to find out the location of the sources of pollution, to assess the impact of, for example, the formation and dispersion of smog, important factors such as temperature and humidity, wind direction, the level of ultraviolet radiation (UV index), to evaluate the pros and cons of geographic location.
OpenWeatherMap interactive maps

Currently, OpenWeatherMap, together with its partners, develops innovative solutions and models, which allow not only to deliver data and API to different data in the clear mode, as is the case now, but also to visualize all this global information clearly presenting it in the form of graphs and interactive maps which makes the work with data suitable for analysis.