четверг, 26 октября 2017 г.

Implementation of modern meteorological models for improving the performance of solar power stations

Weather and climate conditions are some of the primary factors influencing the performance of renewable energy power plants, particularly the performance of photocells in solar batteries.
Weather factors.
Obviously, the intensity of solar radiation has the greatest effect. The efficiency of solar panels is reduced if solar radiation intensity is reduced or absent altogether.
Temperature
Solar batteries perform better at lower temperatures than in a hot climate. Electrical output may be more than normally efficient in winter, in temperatures below freezing.
Cloud cover
Solar radiation reaching the earth’s surface decreases as cloud cover increases. Solar batteries receive maximum sunlight on cloudless days with direct rays of the sun. These are the peak hours when they will be producing the most energy. The light received decreases as the cloud cover increases. Solar batteries will produce minimum usable energy on heavily overcast days. The batteries will work at half their efficiency when there is enough light for objects on the ground to cast a shadow.
Climatic conditions and topography.
To a considerable extent, climatic conditions depend on topography.Mountains, seas and oceans, large lakes and their location relative to each other exercise the greatest influence on the formation and behavior of clouds and on the temperature.This results in the amount of solar radiation in adjacent regions with different topographies varying radically. For example, mountains may get less solar radiation than neighboring foothills and plains. The amount of solar radiation in coastal areas may differ from inland figures.
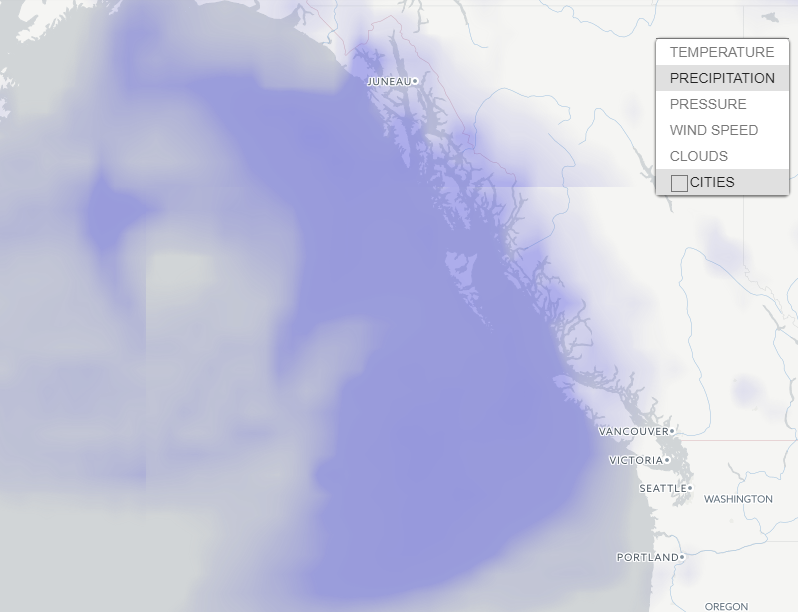
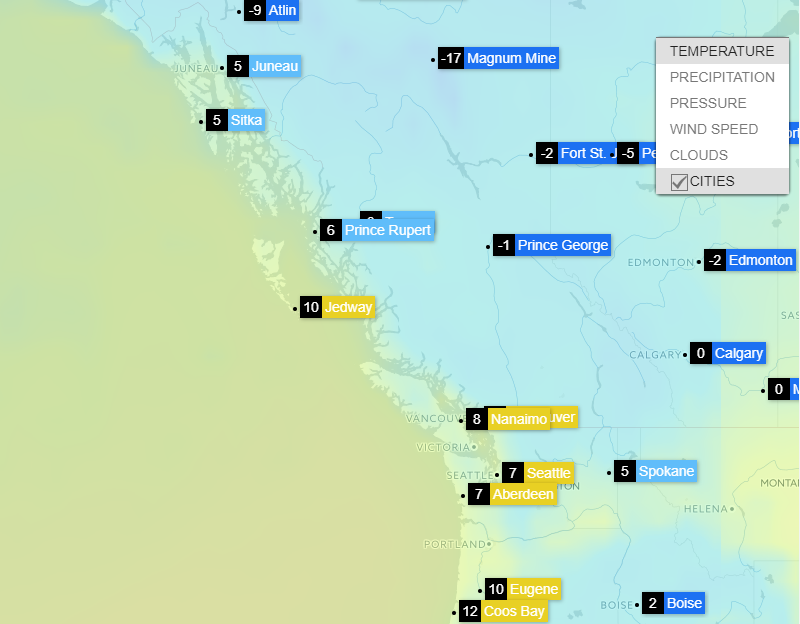
Distribution of precipitation and temperature on the mountainous coast of Canada north of Vancouver 
All these factors need to be taken into consideration in designing plant infrastructure for planning electrical consumption and load.This makes the accuracy, and hence the source, of weather data very important.
Relevance of data is not guaranteed by proximity to a meteorological station in regions with complex topography, such as in mountainous areas or simply areas with sharp changes in elevation.
At present, complex weather calculation models, which it has become possible to generate using modern technologies such as IoT, Cloud Services, and Big Data, are used to obtain accurate weather data.
OpenWeatherMap weather service is based on the VANE Geospatial Data Science platform for collecting, processing, and distributing information about our planet through easy to use tools and APIs.
We are collecting data from weather stations and forecasts of meteorological services and research laboratories, combining long-term and short-term forecasts with real-time data from weather stations, processing them and immediately updating current weather and forecasts in our API. Today we have more than 40,000 weather stations.
Data is stored in the VANE database and processing with our unique algorithms to create interpolated data of current weather conditions anywhere in the world, as well as into a variety of weather maps.

вторник, 17 октября 2017 г.

You are invited to test the new web interface Query Builder for our Vane platform


You are invited to test the new web interface Query Builder for our Vane platform
You can use this simple tool to create your own map in just a few minutes, and with just one click receive a completed link for display on your site or app using a web map library like Leaflet, Open Layer, Mapbox and Google Map.
This version is an improvement over the previous one in terms of simplicity of use and layout. The user can select either one of the available data sources and the required combination of spectral bands or one of the derivative index products such as NDVI, EVI, etc. You can also set up display parameters, including clarity, contrast and gamma correction, or use one of the available schemes provided. After that, all you need is to get an API key and insert it in the prepared link, and you can use it in your programming product. 
We are ready to answer your questions and will be glad to hear any proposals you might have.

понедельник, 25 сентября 2017 г.

Accumulated precipitation data for agriculture

We are happy to announce our new API for the accumulated precipitation data. API based on historical data and focused primarily on users from the agriculture-sector.Accumulated precipitation data is calculated as a sum of all parameters for a peculiar period.

Precipitation, mostly rains, has a huge impact on agriculture. For the growing all the plants need a smallest amount of water at least, and rain is still one of the most effective ways of watering despite the development of modern technologies. Too much or otherwise too little precipitation is bad and even harmful for agricultural plants. Drought can destroy the harvest and can increase erosion as well as the overly humid weather is able to trigger a growth of unfavorable fungi. Moreover, various kinds of plants demand different amounts of precipitation. For example, some succulent species require little water while tropical plants need hundreds of inches of rain a year just to maintain their living. 
A fluctuation of precipitation amounts is quite substantial in continental climates. A fluctuation of month amounts is bigger than those of year. A considerable precipitation variation leads to situations when there is a precipitation lack during some years, and drought takes place thus forming the areas of unstable hydration. With a long absence of rains and at high temperatures the reserves of moisture in the soil dry out due to evaporation. A previous arid season brings a shortage of a crop yield even in a humid season as the harvest lacks time to ripen. Thus disadvantageous conditions for an ordinary plant development are established, and a crop yield of agricultural plants decreases or perishes.   
Along with precipitation amounts, the number of days with precipitation a month or a year is also a significant climatic index. Plants are sensitive about a matter whether a given precipitation amount falls at once during only several days or it rains often and a precipitation amount is distributed comparatively evenly throughout a month. For instance, even one great downpour in a prairie area in summer has a little ability to improve an arid situation. 
Employing a data set of a precipitation amount and a number of days one can calculate an accumulated precipitation amount for any region during a specific period of time.

четверг, 24 августа 2017 г.

OpenWeatherMap weather data for a smart home. Relative humidity

Generally speaking, humidity is the amount of water contained in the air. And relative humidity is the ratio of the mass fraction of water vapor in the air to the maximum possible value of this quantity at a given temperature.

Usually the notion “climate” includes temperature and precipitation. Often such factor as relative humidity is forgotten. It’s necessary to mention that basically one pays little attention to that parameter. Temperature, wind speed, pressure – in this range air humidity is an outsider and improperly deprived of attention. However relative humidity is not only one of the most important articles in weather forecasts, but also one of the defining factors of well-being.

What are the risks behind low and high humidity indoor? 
The atmosphere at home defines the health of house inhabitants a lot. To maintain optimal humidity at home is a necessary condition of good well-being. Too arid or too moist air indoor quickly becomes a source of significant troubles. 
The air indoor is very dry in the heating season, especially in winter. Human body reacts to the lack of moisture with dryness of skin and tissue lining nasal passages, respiratory problems and eye irritation. The arid air contributes to dust diffusion which contains microorganisms and house dust mites. Dust mites are notorious for aggravating allergies in some individuals. The dry air is especially bad for children, whose dust allergy can proceed into bronchitis and asthma. 
High humidity in dwellings leads to formation of fungus on walls, ceiling, corners. The air saturated with mold and its spores is also not the best companion for healthy people to live with. 

How to provide humidity control at homes? 
For the proper humidity control it’s necessary to know a humidity level of your building specifically. The most reliable humidity controller is an accurate humidity indicator. However a humidity level indoor strongly depends on a level of moisture concentration not only inside a building, but also outdoor. In winter the difference between levels of humidity indoor and outdoor is considerable due to the heating systems. Indoor the percentage of moisture in the air is decreased to 15-20%. While the standard humidity rate is 30-60%, and the medium level of comfort has 45% humidity rate. Moreover, these rates are not the same for everybody: they depend on climate, season and dwelling territory. For example, the most comfortable humidity level for Central Europe varies from 40% to 65%. During the winter, the medium level is 50%, and if you live in the tropics, this value is higher. 
To calculate a humidity level which is comfortable and carrying no harm neither people, nor house interior at this very moment, accurate and actual weather data is necessary. 
OpenWeatherMap provides such data for companies throughout the world. This data includes the current and historical weather data and forecasts. And we are very happy to make the lives of people more comfortable and perhaps even save their health.

среда, 23 августа 2017 г.

Pilots are eager to fly. How weather data help to find an airway

Let's consider one of the new interesting cases where weather data by OpenWeatherMap is used. 

Usually it's not a quick and easy deal for pilots to find an air corridor with appropriate weather for flying. Sometimes a search for a starting point of a flight and for its destination point takes up to 1-2 hours. ParaglidingStart.info is an application which uses real-time weather data by OpenWeatherMap alongside with information from many other sources. The application shows the current weather for possible starting points of a flight. There also can be found forecasts and other information like the description of the areas or the airspaces. One can implement further features for the pilots in the future.
Pilots are eager to fly, not to spend time looking for airspaces appropriate for flying. And OpenWeatherMap team is happy that our data help them to do so.

четверг, 10 августа 2017 г.

Intellectual management of buildings. Weather API


Intellectual management of buildings simultaneously solves 2 crucial tasks: it lets decrease  electric power cost and reduce CO2 emission and it all together has a positive effect on ecology.  
For the present moment there exist ready solutions which allow reasonable management of all the equipment: lighting, air conditioning, ventilation, heating, cooling, secure systems, etc.
Effective tools of monitoring observe functioning of a building in real-time mode: the tools calculate energy consumption, analyze current technical issues, trace surplus of CO2 and its emission.
The analysis of data received with the monitoring tools also implements management of processes taking place in buildings remotely. For getting actual information, one needs only to launch a browser.     
And here an easy access to a huge storage of data arrays is really necessary: data of different kinds comes constantly and is being processed in real-time mode. 
Our OpenWeatherMap team is happy to know that our development of weather APIs which are used as a part of global solutions in such projects throughout the world contributes to increasing of energy effectiveness and thus helps to improve ecological situation.   

вторник, 1 августа 2017 г.

UV radiation: Its influence on ecosystems. The tools for secure monitoring — API for UV-index


In recent years, the question of changes happening to a phenomenon of ultraviolet radiation at the earth’s surface attracts increasing attention. The influence of ultraviolet radiation on the life on the Earth is immense. It is enough saying that ultraviolet radiation is one of the most important factors for evolutionary progress of nearly all living creatures. Various ecosystems in their development process have adapted to a level of UV radiation to some extent anyway. Thus it is crucially important for successful functioning of these systems that the UV level stays within a specific range as its abrupt shift can lead to serious consequences, to negative ones and however sometimes to positive. These shifts take their toll on the all ecosystems such as vegetation, freshwater habitats and sees, and certainly they have a strong effect on human activity.

Plants do have the ability to recover, but when a received radiation dose exceeds their regeneration ability so then damage is inevitable. UV radiation damage becomes apparent in decreasing of crop yield and fertility, in lowering of quality of goods and in ecological aftermath such as the change of proportion of cultivated plants and weeds.

It’s also necessary to consider here that UV radiation reduces the wear resistance of materials employed for outdoor usage. Even a slight increase in the level of UV radiation drives to diminishing of a service life of external facilities and to rising of repair and replacement costs. Nowadays effective researches are conducted to register the influence of UV radiation on a human body, and that influence can be beneficial, and what’s more it’s essential for a regular vital activity, and it can be almost destroying for a lively creature.

Data on intensity of UV radiation is highly required recently. Particularly when speaking about substantial changes of climate which are happening now and which are obvious to any ordinary person without any sensitive measuring instruments.

That’s why there are currently in need the tools for secure monitoring and forecasting of these changes, for development of successful management of possible consequences and for reliable assessment of current and future context.

Fortunately, this tool really exists and has been in operation for some time already. Over the past few years, OpenWeatherMap company has provided a significant data volume on UV-index. We deliver UVI current data as well as daily forecasts for a period of 8 days for any locations. Also we have started accumulation of historical data actively.

Then recently we have greatly improved the quality of provided data, that’s our API for UV-index. For example, now there is a new feature to request data on any geographic coordinates without limits on accuracy.
Accuracy of UVI modeled data has been increased twice (the interpolation grid step decreased from 0.5 to 0.25 degrees).
Soon the support of search by city name, city id and zip-code will be available.
You can find the instructions here http://openweathermap.org/api/uvi