вторник, 7 августа 2018 г.

Satellite Images API for Agriculture: NDVI, EVI, TRUE and FALSE color


Satellite images API is the dataset from the Landsat8 and Sentinel2 satellites on the basis of which we calculate quantitative indices, such as NDVI, EVI, and others, and from which we also obtain ready-made images of territories in True and False color, NDVI, and EVI. Satellite images API, along with other APIs to data such as Weather DataSoil Data, Accumulated Temperature and Precipitation Data all go into making our new Agro API product.
TRUE Color and False Color
TRUE Color — "True color" is a rendering of red, green and blue satellite imagery spectral bands to the RGB composite image that seems to look natural.
False Color (b5 b4 b3) — "False color" is a rendering using NIR (near infrared) band which is more useful to visualize land cover and differentiate it from the urban and farmland areas. In these images it is possible to pick out different types of vegetation. Also easily discernible is the boundary between land and water, which enables changes in shorelines to be tracked.
NDVI and EVI vegetation indices
Some of the most common indices enabling quantitative assessment of vegetation cover. Convenient for tracking the growth rate of plants and monitoring any changes to them.
NDVI - This is an index calculated according to a set formula which uses near infrared and red wavelengths. Used in calculating and monitoring vegetation growth and its dynamics. NDV Index is displayed in images using the white to green palette where dark green indicates a good yield and white indicates a poor one or lack of vegetation.
EVI  -  In areas of the dense canopy where the Leaf Area Index (LAI) is high, NDVI values can be improved using information from the blue wavelength. Information in this part of the spectrum can help correct atmospheric influences and background interference caused by soil.
TRUE color

Paddy fields in Pangasinan province, Philippines
Using the NDV index enables the field boundaries to be clearly discerned


With NDVI, the sections of the fields are displayed as barren, in white color. In the False color regime, it can be seen that part of them is waterlogged.

NDVI

Rice terraces in Tuguegarao province, Philippines.

 The EVI image looks clearer 


We provide a historical data as well as satellite images that are as up-to-date as possible (allowing for the data source and cloud cover) for the very nearest time period. These satellite images are available to all account users, including those who are using the free package.
The full set of the AGRO API capabilities can be seen here 

Satellite images API


Today, we would like to look in more detail at one of the essential elements of our Agro API, Satellite images API. Satellite images API is the dataset from the Landsat 8 and Sentinel 2 satellites on the basis of which we calculate quantitative indices, such as NDVI, EVI, and others, and from which we also obtain ready-made images of territories in TRUE and False colorNDVI, and EVI
We provide a historical data as well as satellite images that are as up-to-date as possible (allowing for the data source and cloud cover) for the very nearest time period. These satellite images are available to all account users, including those who are using the free package. For non-paying users, the range for satellite data requests is 6 days.  For the paid service, it is one year.  Learn more.
Please note that there are limitations on the total area for which data can be requested as well as the number of requests that can be made per minute. However, should you exceed these figures, we will continue to provide you with the data you need so that your work is not affected and your customers do not run and hide!*
All of the details and the full set of the Agro API capabilities can be viewed here.
As always, we would be glad to hear your remarks and suggestions regarding our product!
* At the end of your billing month, we will provide you with a separate bill for any additional area, beyond the tariff limits, for which you requested data.

Helping farmers manage their enterprises: weather and satellite APIs for agroservices


Objectives:
As farms mainly consist of crop fields, which can be hundreds of acres in size, much time and resources are demanded of farmers in obtaining an accurate picture of the overall condition of these farms.
Drying out of plants or, conversely, an excess of moisture and a rise in the number of pests: these can all take their toll on the size and quality of the harvest and demand a rapid response. There are also such problems as the danger of overusing fertilizers, which poses a threat not only in terms of extra costs but also in that it is harmful to the environment and primarily to the health of farmers themselves.
To maximize harvests, constant monitoring is required throughout the season; and it is not easy finding the time to keep up with changes for each crop, not to mention monitoring the condition of every single acre. When deciding on long-term plans, a comparative analysis has to be carried out for both the usual course of the seasonal cycle and, in particular, any crises that have arisen.
To assess the current situation and to keep track of changes compared with preceding seasons and with the condition of neighboring fields, accurate information on both the past and the present is needed as well as future forecasts that are as precise as possible.
Solutions:
There are currently numerous services that help with managing farms for any acreage: checking boundaries and nutrient and moisture intake, monitoring the negative effects of weather conditions and diseases, and controlling pest numbers. And this can all be done without having to visit the fields, just by using a phone or tablet screen or a PC.
It is exactly to provide these services that OpenWeather offers a wide range of APIs for different weather and satellite data combined in the one product, Agro API, with universal and simple syntax.
What we offer:
About Agriculture API
Our product comprises a set of straightforward and user-friendly APIs which are easy to embed in farming applications. Each API is dedicated to its own particular area which means the user can be flexible about how often the data is updated and receive only information that is necessary.
By using our satellite and weather data, the user can assess the condition of farmland in real time and start planning.
This product is also geared toward the insurance and banking sector and can be used as a farm rating tool.
We provide the full range of data from satellites and weather stations for monitoring the condition of farmland and for making subsequent decisions.
All data processing is carried out online
Weather: Current, Forecast, History
Air temperature, humidity, wind speed, etc.. We provide not only current readings but also historical data for analysis and weather forecasts.
TSOIL & MSOIL: Temperature and Soil Moisture
Crucial indices allowing you to adjust irrigation work and prevent crop root damage
PA & TA: Accumulated Temperature and Precipitation
Temperature quantity index, expressed as the sum of diurnal temperatures exceeding a set threshold. Humidity quantity index, expressed as the sum of precipitation . This data is essential to decision-making regarding the date and favorability of conditions for sowing important crops.
NDVI & EVI: Normalized Difference Vegetation Index & Enhanced Vegetation Index
One of the most common indices allowing assessment of vegetation cover. We provide
current and historical data to allow analysis of vegetation growth rates and subsequent forecasting.
UV index: Ultraviolet Index
UV radiation has a direct effect on plant photosynthesis. Short-wavelength UV light in small quantities can increase the growth of certain types of plants and have a beneficial effect on further development, while constant exposure to medium-wavelength UV can kill crops. This index is useful for a complete analysis of potential agricultural land.
TRUE & FALSE Color:
Mainly used to visualize vegetation cover and differentiate it from urban land and any land not used for agricultural purposes. With these images it is also possible to distinguish between different types of vegetation.
Weather data can be requested both for a particular point and for a polygon*.
We are offering you the chance to try out our free package. All you have to do is set up a user account** and you will receive a personal API key.
We have also put together paid services as part of which the user is provided with a wider range of functions, which you can find out about here
* Currently, as part of the existing paid packages, we are providing data that is of the utmost relevance to agribusiness. Other territories can be added upon request.
** Users who are already registered can use their username and password for their new account 

NEW! Agro API - service for Agriculture


OpenWeatherMap team are pleased to announce that we are launching a new product aimed primarily at specialists developing agricultural services and addressing the specific requirements of this sector. This product is also geared toward the insurance and banking sector and can be used as a farm rating tool.
As part of this product, we are providing an API for receiving weather data (current weather, forecasts and history), satellite data (current and historical) and weather and vegetation indices based upon this.  As well as the data we already provide in other products, here we have added specialized agricultural indices such as soil temperature and moisture, accumulated temperature, cumulative precipitation and satellite data*: images from space and vegetation indices (EVI and NDVI) based upon them. Weather data can be requested both for a particular point and for a polygon. Find out more here.
We are offering you the chance to try out our free package. All you have to do is set up a user account** and you will receive a personal API key.
We have also put together paid services as part of which the user is provided with a wider range of functions, which you can find out about here
* Currently, as part of the existing paid packages, we are providing data that is of the utmost relevance to agribusiness. Other territories can be added upon request.
** Users who are already registered can use their username and password for their new account
We look forward to your feedback and comments! We will be glad to answer any questions you might have.

среда, 10 января 2018 г.

OpenWeatherMap 2017: Results of the Year

So the, new year, 2018 has come, and it's time to sum up the results of the past year for our company, OpenWeatherMap (UK, US and Latvia), developers of one of the best weather APIs in the world. 
A lot happened and much has changed. 
During the year, our number of users grew from 600,000 to 1 million. We participated in the Startup Grind Global Conference in Silicon Valley where the team from OpenWeatherMap was named in the top 50 Startup Exhibitions of 2017. Our mature team was filled up with excellent professionals and wonderful people. 
We did a lot of new things and qualitatively improved our current developments. 
In 2017, we were pleased to present to you:
Weather data: API and Weather Maps
  • The Open Dashboard for Agricultural Monitoring 
     can help give you an idea of the possible use for meteorological and satellite data in your agricultural applications.
  • Specially for the agriculture sector, we launched an API for accumulated temperature data and an API for accumulated precipitation data.
  • The Weather Historical Bulk service. 
    Now you can simply choose a city (or several cities) and download an archive, which contains bulk file with the weather history up to 5 years - any day, week or even several years.
  • A new and improved version of an API for UV-index
     
     
    Throughout the entire year, we worked constantly on our history weather API. For this year, the amount of data supplied and speed to process that data increased significantly. Also, we made it possible to quickly upload data in a format that doesn’t require additional processing and can be understood by any user. 
    Our Weather Maps app changed qualitatively. 
    This year, we added the ability to switch the layers of weather and satellite maps, create various combinations with them, and connect them to mobile and web apps.
Satellite data: Vane platform
This year, we significantly improved our satellite platform. Our team undertook a huge amount of work and in June were able to present  a new version  of the satellite image processing  platform VANE.
Based on the Vane platform, we developed a new product called  Global Satellite Base Map, which uses visual tools and query language to generate a map from satellite images. The uniqueness of the product is that all data processing is done on the fly, and there are no presets or pre-made calculations. The user defines the parameters for a calculation and image processing and immediately receives a result for any territory. This capability was only possible thanks to Vane, our super powerful data processing platform.
We recently presented you with Query Builder, our new interface for the Vane platform. Now you can use this simple tool to create your own map in just a few seconds, and with just one click receive a completed link for display on your site or app using a web map library like Leaflet, Open Layer, Mapbox and Google Map.
We are grateful to everyone that worked with us for all this time. We thank you all your feedback and for not getting bored by our tech support. 
We have a ton of plans for the coming year. Stay tuned, and you will see a lot of the new and interesting things to come. Subscribe to our Telegram Channel https://t.me/openweathermap and get news first about our updates and new products!

Cloudless: global cloudless composite coverage based on the VANE Platform

In the drawing is global coverage obtained between 06.01.2017 and 09.01.2017 using data from the MODIS spectroradiometer aboard KA Terra and Aqua.
The current cloudless coverage of the Earth by medium and low-resolution satellite images are an important element in the regional and global systems that monitor the territorial changes caused by natural and man-made factors. For example, assessing the damage inflicted by forest fires caused by deforestation, volcanic eruptions, flooding,etc. Also, such types of coverage are popular as the base layer for cartographic web services.
The main stages of creating such coverage are: the selection of images, expert as a rule, the masking of clouded areas, tonal adjustment of images taken at different times of the year, and pasting them into single coverage using so-called “cutlines” which enable, to a certain extent, the joins between the pasted images to be hidden. Such operations, as a rule, are carried out in semi-automatic mode and require specialized software and highly qualified experts, which substantially increases both the time taken to create such a product and its cost.
We have designed and delivered a completely different approach to producing such coverage. At the heart of this approach lie the principles used in processing Big Data and machine-learning algorithms. The technology we have implemented allows us to obtain, in a fully automatic mode, the very best coverage, in terms of cloud cover, of the Earth for a specified time frame. Not only this but the technology we use for data preprocessing means that a composite product can be obtained using either one or several different data sources. To obtain a composite image, we carry out a pixel by pixel analysis of all images stored in our database for a specified time frame. As a result, a single value, the best in terms of cloud cover, is selected. By assembling such values from there, complete coverage is produced. 
At the present time, the most popular, due to its high performance and general accessibility, is the data received from images taken by the Landsat-8 satellite and the Sentinel-2 pair of satellites. It is also worth noting that images from satellite data are taken in near spectral bands which, in turn, simplifies its simultaneous analysis.
In the drawings below are fragments of composite coverage collected from data from Landsat-8 and Sentinel-2, 2016-2017.


вторник, 19 декабря 2017 г.

The Weather and Sea Transport. Using Forecasts and Weather Maps for Effective Route Planning

The Weather and Sea Transport. Using Forecasts and Weather Maps for Effective Route Planning
Posted on 2017-12-11 13:55
It isn’t possible to affect weather conditions, but what is possible is to predict them.
Services currently available provide not only accurate up-to-date weather reports, and forecasts for different time-periods, but they also provide visual displays of various weather phenomena on weather maps, allowing a quick assessment of the overall picture. For such a weather-dependent industry as sea transportation, receiving timely accurate and visual information is particularly important.
Sea transport is one of the most tried and trusted ways of delivering cargo. Shipping lanes don’t need rebuilding or to be kept in working order. This is precisely why sea freight doesn’t cost as much as other modes of transportation.
Its main disadvantages are the long delivery time and the dependence of the vessel on weather conditions.
The most important meteorological variables which determine sailing conditions for sea vessels are the wind and those things which are dependent upon it: the condition of the water’s surface, precipitation, and temperature.
The Wind
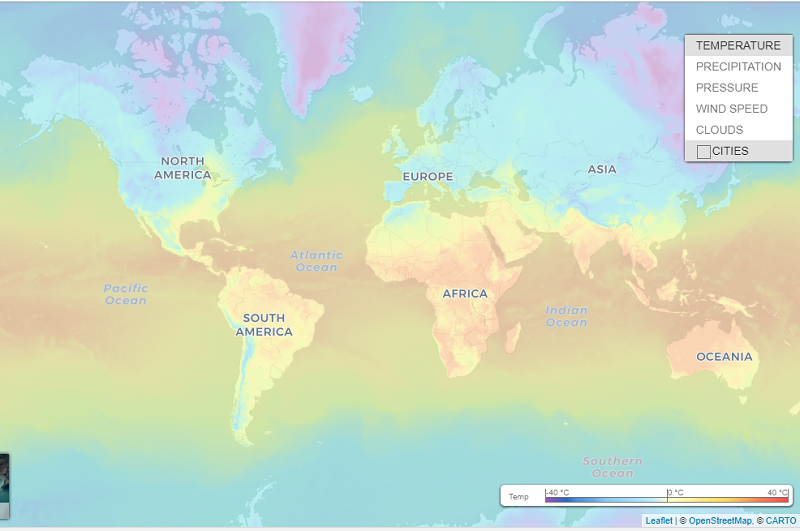
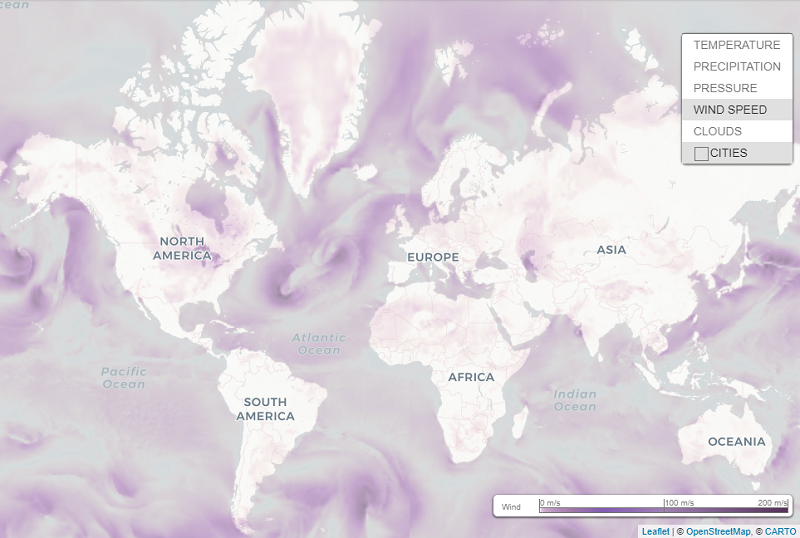
The critical wind threshold for sea transport is lower than that for overland transport. According to a technical study carried out in the 50s and 60s, a fair wind increases the speed of a sea vessel by approximately 1%, whereas a head wind can reduce it, depending on the size of the vessel and its load, by 3-13%. More significant in its effect on the vessel are the sea’s waves caused by the wind. When waves reach higher than 4m, sea-going vessels are forced to slow down or change course. With high waves, the duration of the voyage, fuel consumption, and the danger of damage to the cargo rise sharply, thus, based on meteorological data, a route is plotted to circumvent such areas.

Precipitation and Cloud Cover.
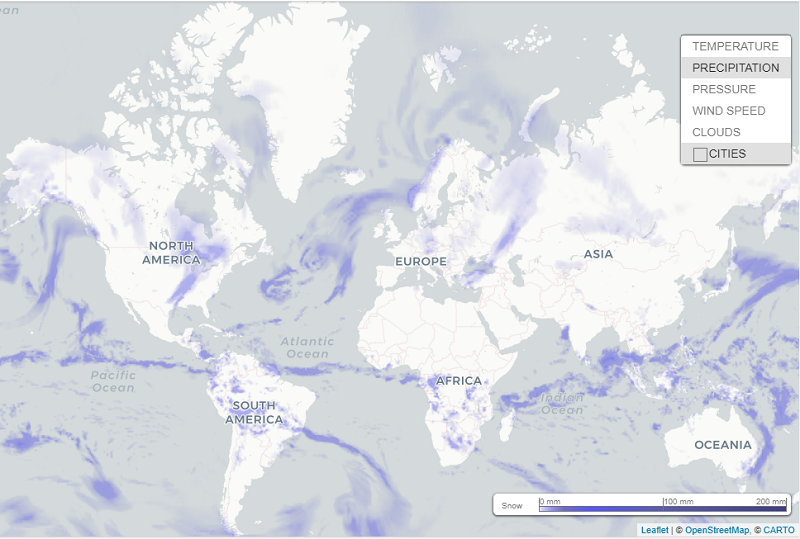
Heavy precipitation reduces visibility and affects radar function. Bright flashes from reflected sunlight also make for poor visibility, necessitating a change in course and reduction in speed.
It is vitally important to have timely information about such phenomena as thunderstorms and cumulonimbus clouds; waterspouts and severe squalls are fraught with danger for ocean-going crafts. Equatorial waters are also associated with the risk of tropical cyclones - typhoons, hurricanes, and so on.

Air Temperature.

Dropping temperatures bring the risk of sea-vessels icing-up. More often than not this is a problem for sailing in high latitudes, however in air temperatures of lower than zero it can occur in middle latitudes too, especially in strong winds and rough seas when there is a lot airborne spray. The main danger with icing-up is the rising in the vessel’s center of gravity due to the build-up of ice on its upperworks. Heavy ice formation renders the vesselunsteady, and brings the very real threat of capsizing.
Air temperatures dropping below 0 ° C (32 ° F) makes the crew’s work more difficult as the water, thrown up as spray or forming a fine mist, accumulates as ice, making operations on deck hazardous to perform.
In such circumstances, accurate weather data, both forecasts and current reports, has a crucial influence on plotting routes, making for a much faster and economically efficient voyage with minimum risk to the vessel and its cargo, and with maximum safety for the passengers and crew.
For plotting intercontinental sea trade routes, historical data is particularly useful. It is also used in compiling timetables for passenger ships and in the planning of marine transportation.

Weather Maps as a Tool for Displaying Weather Events. The Weather Map Service

Weather maps are a visually intuitive way of analyzing large-scale weather events such as cloud cover, pressure, rainfall, and monitoring them in real-time.

Our Weather Map service provides the capability of combining and visualizing satellite and meteorological layers on the same map.
All currently available sets of data on snow, wind, precipitation and cloud cover can be input onto the map to display the desired combination of weather for any given route.
For example, using our tool to customize weather maps Map Editor 2.0 it is possible to put weather data together with a variety of online maps, for example shipping lane charts, creating a combination of different weather layers.

We encourage you to try your own custom styled “weather maps” that can be connected to your map application or even to your professional GIS software that supports TMS or tiled rasters connection services.
Another way to expand the “Weather maps” service capabilities is to add forecast and history requests. Although this possibility is not available in freely accessible API now - just hit us up if you are interested in such kind of service.