Posted on 2017-12-11 13:55
It isn’t possible to affect weather conditions, but what is possible is to predict them.
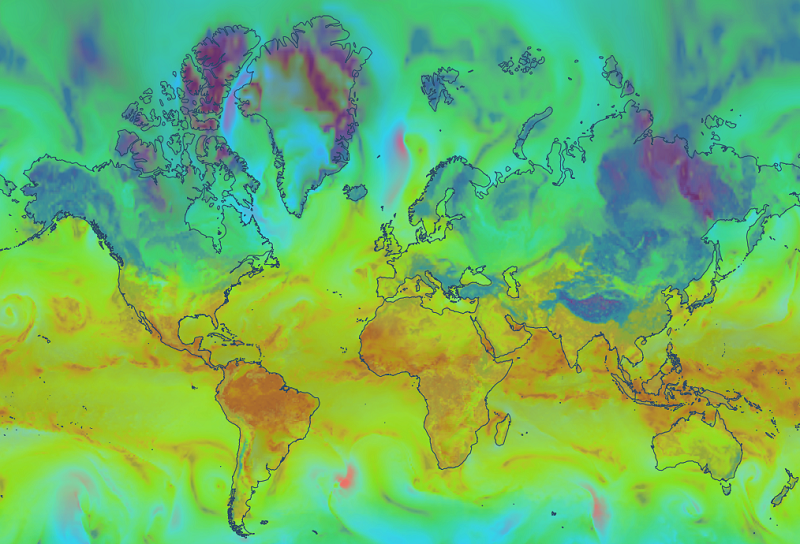
Services currently available provide not only accurate up-to-date weather reports, and forecasts for different time-periods, but they also provide visual displays of various weather phenomena on weather maps, allowing a quick assessment of the overall picture. For such a weather-dependent industry as sea transportation, receiving timely accurate and visual information is particularly important.
Services currently available provide not only accurate up-to-date weather reports, and forecasts for different time-periods, but they also provide visual displays of various weather phenomena on weather maps, allowing a quick assessment of the overall picture. For such a weather-dependent industry as sea transportation, receiving timely accurate and visual information is particularly important.
Sea transport is one of the most tried and trusted ways of delivering cargo. Shipping lanes don’t need rebuilding or to be kept in working order. This is precisely why sea freight doesn’t cost as much as other modes of transportation.
Its main disadvantages are the long delivery time and the dependence of the vessel on weather conditions.
The most important meteorological variables which determine sailing conditions for sea vessels are the wind and those things which are dependent upon it: the condition of the water’s surface, precipitation, and temperature.
The Wind
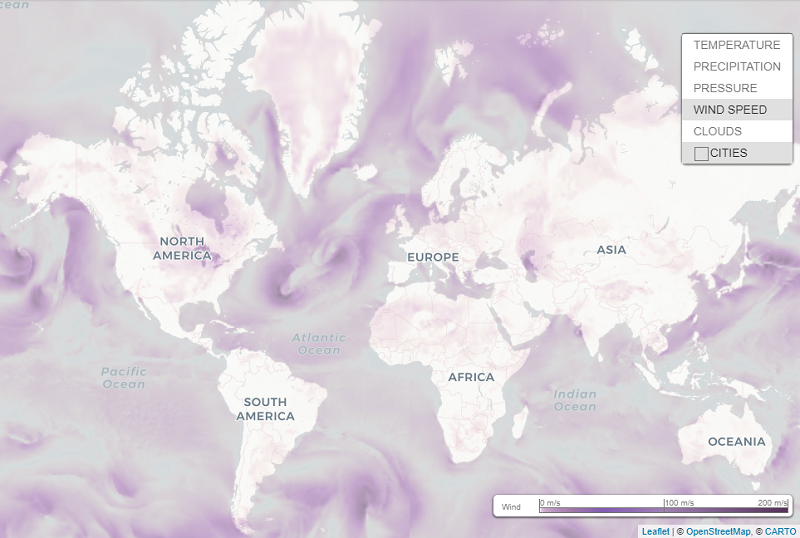 The critical wind threshold for sea transport is lower than that for overland transport. According to a technical study carried out in the 50s and 60s, a fair wind increases the speed of a sea vessel by approximately 1%, whereas a head wind can reduce it, depending on the size of the vessel and its load, by 3-13%. More significant in its effect on the vessel are the sea’s waves caused by the wind. When waves reach higher than 4m, sea-going vessels are forced to slow down or change course. With high waves, the duration of the voyage, fuel consumption, and the danger of damage to the cargo rise sharply, thus, based on meteorological data, a route is plotted to circumvent such areas.
 The critical wind threshold for sea transport is lower than that for overland transport. According to a technical study carried out in the 50s and 60s, a fair wind increases the speed of a sea vessel by approximately 1%, whereas a head wind can reduce it, depending on the size of the vessel and its load, by 3-13%. More significant in its effect on the vessel are the sea’s waves caused by the wind. When waves reach higher than 4m, sea-going vessels are forced to slow down or change course. With high waves, the duration of the voyage, fuel consumption, and the danger of damage to the cargo rise sharply, thus, based on meteorological data, a route is plotted to circumvent such areas.
Precipitation and Cloud Cover.
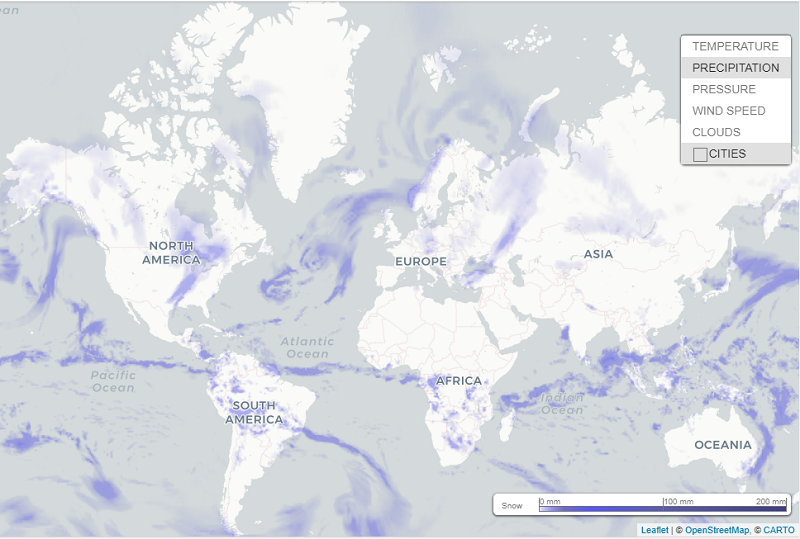 Heavy precipitation reduces visibility and affects radar function. Bright flashes from reflected sunlight also make for poor visibility, necessitating a change in course and reduction in speed.
It is vitally important to have timely information about such phenomena as thunderstorms and cumulonimbus clouds; waterspouts and severe squalls are fraught with danger for ocean-going crafts. Equatorial waters are also associated with the risk of tropical cyclones - typhoons, hurricanes, and so on.
Air Temperature.
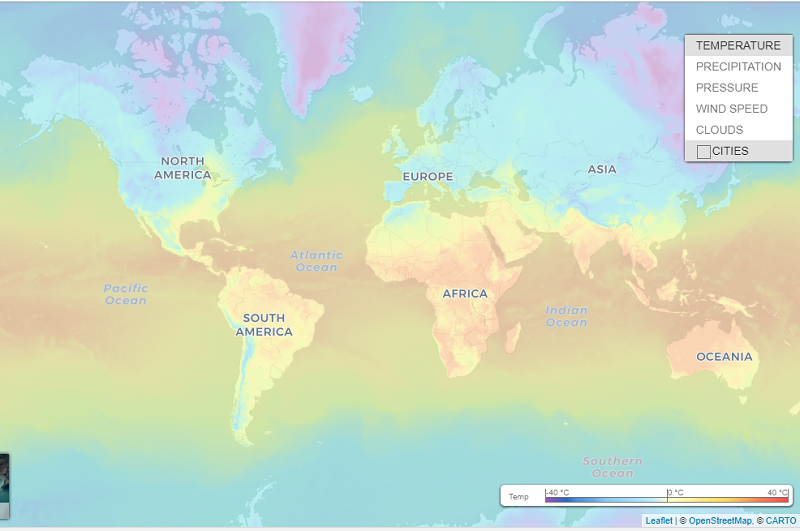
Dropping temperatures bring the risk of sea-vessels icing-up. More often than not this is a problem for sailing in high latitudes, however in air temperatures of lower than zero it can occur in middle latitudes too, especially in strong winds and rough seas when there is a lot airborne spray. The main danger with icing-up is the rising in the vessel’s center of gravity due to the build-up of ice on its upperworks. Heavy ice formation renders the vesselunsteady, and brings the very real threat of capsizing.
Air temperatures dropping below 0 ° C (32 ° F) makes the crew’s work more difficult as the water, thrown up as spray or forming a fine mist, accumulates as ice, making operations on deck hazardous to perform.
In such circumstances, accurate weather data, both forecasts and current reports, has a crucial influence on plotting routes, making for a much faster and economically efficient voyage with minimum risk to the vessel and its cargo, and with maximum safety for the passengers and crew.
For plotting intercontinental sea trade routes, historical data is particularly useful. It is also used in compiling timetables for passenger ships and in the planning of marine transportation.
Weather Maps as a Tool for Displaying Weather Events. The Weather Map Service
Weather maps are a visually intuitive way of analyzing large-scale weather events such as cloud cover, pressure, rainfall, and monitoring them in real-time.
Our Weather Map service provides the capability of combining and visualizing satellite and meteorological layers on the same map.
All currently available sets of data on snow, wind, precipitation and cloud cover can be input onto the map to display the desired combination of weather for any given route.
For example, using our tool to customize weather maps Map Editor 2.0 it is possible to put weather data together with a variety of online maps, for example shipping lane charts, creating a combination of different weather layers.
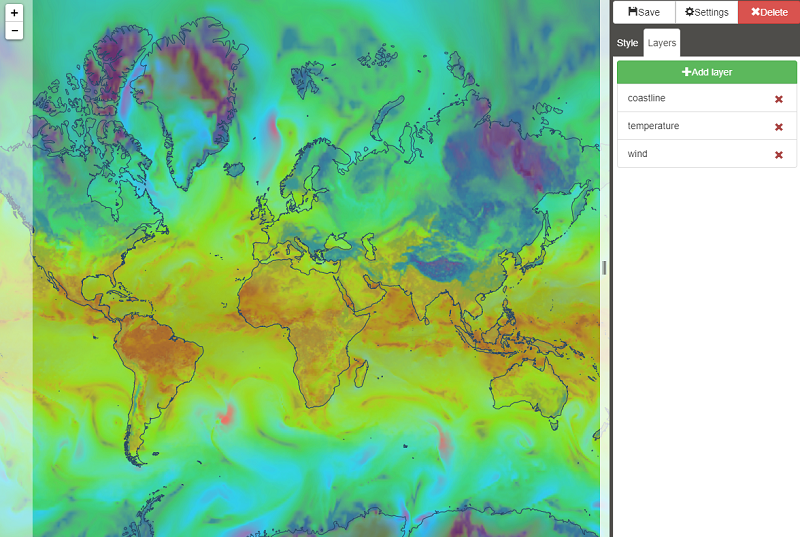
We encourage you to try your own custom styled “weather maps” that can be connected to your map application or even to your professional GIS software that supports TMS or tiled rasters connection services.
Another way to expand the “Weather maps” service capabilities is to add forecast and history requests. Although this possibility is not available in freely accessible API now - just hit us up if you are interested in such kind of service.
Комментариев нет:
Отправить комментарий