среда, 14 декабря 2016 г.

Satellite imagery: Landsat 8 and its Band Combinations.


In the current version of VANE Language, we use images from Landsat8 satellite which captures the Earth’s entire surface every 16 days. The satellite makes hundreds of images with a unique name for each one like LC81410552016219LGN00 and a pixel size of 30 meters, each image consists of 11 bands, the size of the uncompressed image is 2 GB.
Landsat 8 Operational Land Imager (OLI) and Thermal Infrared Sensor (TIRS) images consist of nine spectral bands with a spatial resolution of 30 meters for Bands 1 to 7 and 9. New Band 1 (ultra-blue) is useful for coastal and aerosol studies, and also new Band 9 is applicable for cirrus cloud detection. The resolution of Band 8 (panchromatic) is 15 meters. Thermal Bands 10 and 11 provide more accurate surface temperatures and are collected at 100 meters. Approximate scene size is 170 km north-south by 183 km east-west (106 mi by 114 mi).
By default, we get B2, B3, B4, B5, B7, but it is possible to download any other bands.
Landsat 8 Operational Land Imager (OLI) and Thermal Infrared Sensor (TIRS) Launched February 11, 2013
Band 1 — Coastal aerosol, Band 2 — Blue, Band 3 — Green, Band 4 — Red, Band 5 — Near Infrared (NIR), Band 6 — SWIR, Band 7 — SWIR, Band 8 — Panchromatic, Band 9 — Cirrus, Band 10 — Thermal Infrared (TIRS), Band 11 — Thermal Infrared (TIRS)

Let’s consider how these bands and their combinations can be used to visualize Landsat 8 images.

Bands 2, 3, and 4
Blue, green and red spectra combine together for creation of full color images.
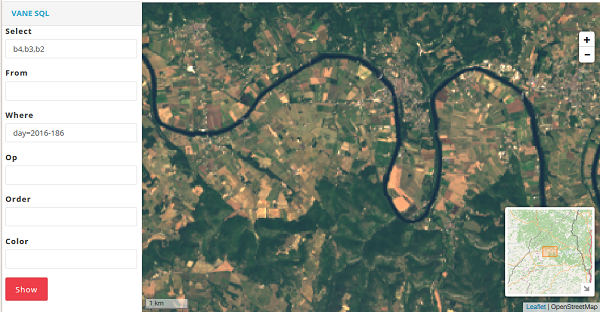
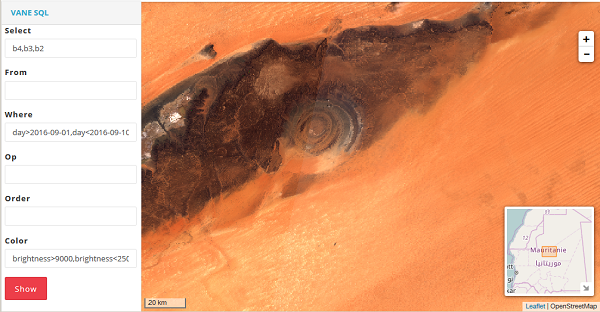
One of the simplest operations is to generate RGB map. Here an image consists of Bands 4–3–2 which correspond to the well-known RGB color model.
image #1


France, a spot near Toulous.

image #2


The Sahara desert.

Band 5
Near Infrared (NIR) — this part of the spectrum is one of the most frequently used as healthy plants reflect it mostly: water in their leaves scatters the wavelengths back into the sky. This information gets useful for vegetation analysis. By matching this band with others, one can get indexes like NDVI, which provide more precise measurement of plant condition comparing with only looking at visible greenness.


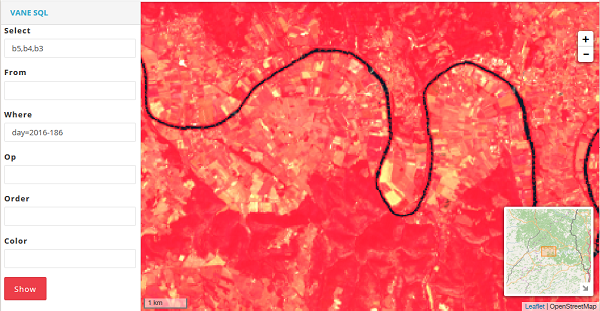
Let’s look at image #1 in the 5–4–3 band combination.

5, 4, 3 — Traditional Color Infrared (CIR) Image
Pay your attention how healthier vegetation beams in red more clearly. This band combination is often used for remote sensing of agricultural, forest and wetlands.
Bands 7 — The Shortwave Infrared (SWIR2)
Spectra Shortwave Infrared let clearly distinguish wet soil from dry one, and also differentiate the earth’s structure: rocks and soils that can look almost similar in other bands have strong distinction in SWIR.


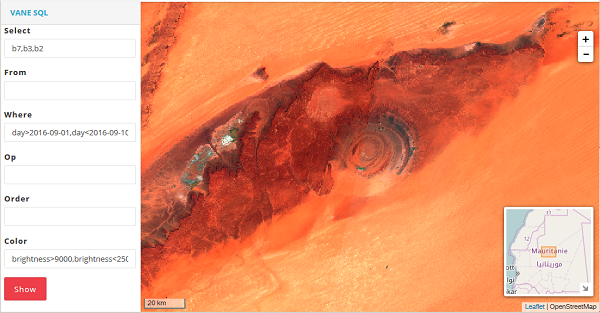
We get the following picture if we take image #2 and use infrared band 7 instead of red band 4.

7, 5, 2 — False color image
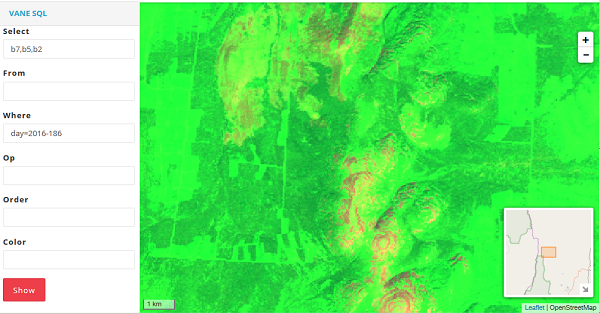
This band combination is convenient for the monitoring of agricultural crops which are displayed in bright green color. Bare earth is showed in purple color while not cultivated vegetation appears in subtle green.
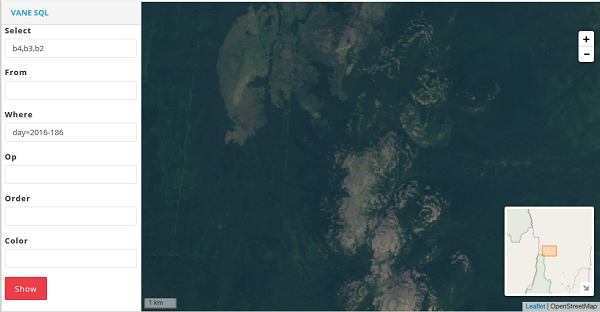
Compare the image made in essential RGB colors:


And here is the 7–5–2 band combination:


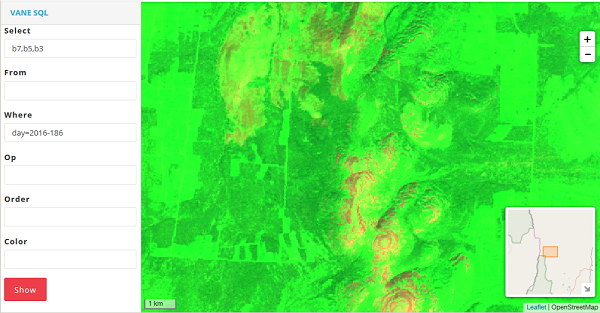
7, 5, 3 — False color image
This false color image shows land in orange and green colors, ice is depicted in beaming purple, and water appears to be blue. This band combination is similar to the 7–5–2 band combination, but the former shows vegetation in more bright shades of green.


среда, 26 октября 2016 г.

Examples of VANE Language: NDVI


The NDVI, i.e. the normalized difference vegetation index, is a simple graphical indicator of biomass active photosynthetically.The NDVI is one of the most common and widely used indexes for evaluation of vegetated areas, their quality and quantity. Using the NDVI it is possible to detect presence of plants, its dynamics of emergence and growth. For getting of this index there is Band 5 which measures the near infrared spectrum, or NIR (Near Infrared). This part of the spectrum is reflected by water in leaves of healthy plants. Maps of the NDVI with dynamics (in various seasons) let tracing peculiar features and deviations of seasonal vegetation.
http://owm.io/sql-viewer?select=b5,b4&where=day=2016-200&op=ndvi&lon=-102.21&lat=34.3264&zoom=12

вторник, 25 октября 2016 г.

How to use OpenWeatherMap UV index


Thank you for the article  Francesco Azzola
 http://www.survivingwithandroid.com
 @survivingwithan
 https://it.linkedin.com/in/francescoazzola

This post describes how to use OpenWeatherMap UV index. This is an interesting API because we can use it to explore some important aspects about Android and location aware API. Openweathermap provides this API for free! As you may already know, Openweathermap provides also a full set of API about weather information: you can get current weather conditions, forecast, historical information and so on. This information is free and we can use Openweathermap API free of charge.
Focusing on this article, at its end, we will build an Android app that gets UV index and show it using Material design guidelines.
Before diving into the app details is useful to have an idea about UV index.
Brief Introduction to UV index
UV index (or Ultraviolet index) is an international standard to measure the ultraviolet radiation at particular place and time.
The purpose of this index is to help people protect themselves from UV radiation. So this index is very important and useful.
The UV radiation is measured using a linear scale proportional to the UV intensity.
It is important, then, to know how to get this information from OWM.
OpenWeatherMap UV Index API
To get the UV Index from OpenWeatherMap, it is necessary to send the current location expressed as latitude and longitude:
http://api.openweathermap.org/v3/uvi/{lat},{lon}/current.json?appid={your-api-key}
and of course, the api-key.
You can the API key creating an account.  This is free and you can use to this link.
If you want to have a UV index at a specific time you can use this API:
http://api.openweathermap.org/v3/uvi/{location}/{datetime}.json?appid={api_key}
where datetime is expressed using ISO 8601. As you can notice, these two API are very simple to use. If you want to have more information you can go to the API doc.
According to the documentation, the JSON response is easy to parse. It looks like:
{
   "time": "2016-03-03T12:00:00Z",
   "location": {
                   "latitude": 40.75,
                   "longitude": -74.25
               },
   "data": 3.11
}
Now we have all the information we need to build our app.
To invoke the OpenWeatherMap API is very simple once we known the current location (latitude and longitude). Let us assume, by now, that we have already the latitude and longitude.
Our Android app has to make an HTTP call to the OpenWeatherMap API and parse the JSON response. (If you want to have more information go to how to invoke Openweathermap API in Android).
As HTTP client library, the app uses OkHttp library, so the build.gradle is:
dependencies {
  ..
  compile 'com.android.support:appcompat-v7:23.2.1'
  compile 'com.android.support:design:23.2.1'
  compile 'com.google.android.gms:play-services:8.4.0'
  compile 'com.squareup.okhttp3:okhttp:3.2.0'
}
Once the dependency is configured, making an HTTP request is very simple:
private void handleConnection(Location loc) {
  double lat = loc.getLatitude();
  double lon = loc.getLongitude();
  // Make HTTP request according to Openweathermap API
  String url = UV_URL + ((int) lat) + "," + ( (int) lon) + "/current.json?appid=" + APP_ID;
  System.out.println("URL ["+url+"]");
  Request request = new Request.Builder()
    .url(url)
   .build();
  httpClient.newCall(request).enqueue(new Callback() {
   @Override
   public void onFailure(Call call, IOException e) {
    // Handle failure in HTTP request
   }
  @Override
  public void onResponse(Call call, Response response) throws IOException {
   // Ok we have the response...parse it
   try {
    JSONObject obj = new JSONObject(response.body().string());
    final double uvIndex = obj.optDouble("data");
    System.out.println("UV Index ["+uvIndex+"]");
    JSONObject jsonLoc = obj.getJSONObject("location");
    final double cLon = jsonLoc.getDouble("longitude");
    final double cLat = jsonLoc.getDouble("latitude");
    Handler handler = new Handler(MainActivity.this.getMainLooper());
    handler.post(new Runnable() {
      @Override
      public void run() {
       // Handle UI Update
      }
     });
  }
  catch(JSONException jex) {
    jex.printStackTrace();
   }
 }
});
}
The final result is shown in the picture below:
image00.png
The color of the value shown in the image above changes according to UV Index scale.
Get current longitude and latitude 
As told before, to get the current UV index, we need to use current location expressed using Latitude and Longitude.
As you may already know Google play services is a set of services that extend the Android app features providing a set of new services like Google Map, Google plus, Location Service and more. Using Google play location services we can build a location aware app.
Google play service setup
The first thing is setting up the Google play location service in build.gradle:
dependencies {
  ..
  compile 'com.google.android.gms:play-services:8.4.0'
  ..
}
Now the library is ready and we can use it in developing our Android app.
Moreover, the Android UV Index app should be aware of the current location so that it can pass the latitude and longitude to the OpenWeatherMap API to get the current UV Index.
We have to develop then a Google play services client to invoke the services exposed by Google play so that the app can retrieve the current location.
Google play location service client
Making the client is very simple and we need just a few lines of code:
private void initGoogleClient() {
     googleClient = new GoogleApiClient.Builder(this)
         .addConnectionCallbacks(this)
         .addOnConnectionFailedListener(this)
         .addApi(LocationServices.API)
         .build();

}
At line 5, we specify we use LocationServices.API. The initGoogleClient is called in onCreate method so that we initialise the Google play location services client as soon as the app starts.
It is important to remember to disconnect the client to the services when the app stops:
@Override
protected void onStop() {
  googleClient.disconnect();
  super.onStop();
}
and to reconnect the client when the app starts:
@Override
protected void onStart() {
  googleClient.connect();
  super.onStart();
}
One more thing before the Google play services is ready, it is necessary to register the app to listen when the connection fails or the connection is ready:
// Connection failure
@Override
public void onConnectionFailed(@NonNull ConnectionResult connectionResult) {
  showErrorMessage();
  return;
}
// Connection established
@Override
public void onConnected(@Nullable Bundle bundle) {
  getUVIndex();
}
The Goolge play services client is ready and as you can notice when the connection is ready the app retrieves the UV Index.
Assembling the location aware app
Finally, it is necessary to grant the permission in the Manifest.xml:
  <uses-permission android:name="android.permission.ACCESS_COARSE_LOCATION"/>
At the end to invoke correctly the UV index API, we can ask the last known location using:
private Location getLocation() {
  try {
    Location loc = LocationServices.FusedLocationApi.getLastLocation(googleClient);
    return loc;
  }
  catch(SecurityException se) {}
    return null;
  }
}
where googleClient is the client we talked about in the previous paragraph.
This method can return null value so the app can register itself for location updates so that it gets informed when the location changes:
LocationRequest req = new LocationRequest();
req.setInterval(60 * 60 * 1000);
req.setPriority(LocationRequest.PRIORITY_BALANCED_POWER_ACCURACY);
LocationServices.FusedLocationApi.requestLocationUpdates(googleClient, req, this);
where the interval is the notification interval. To know more about LocationRequest refer to the official documentation.
Test Location aware app
To test the app, it is necessary to use a simple Android app that returns fake GPS location and enables fake GPS position in your smartphone under the developer section in the configuration menu.
Source code available @github.
(c) http://www.survivingwithandroid.com for OpenWeatherMap

пятница, 21 октября 2016 г.


Examples of VANE Language:
13 October 2016. Burning oil wells, Iraq, Al-Qayyara.(Via  http://edition.cnn.com/2016/10/12/world/burning-oil-wells-isis-iraq/)
"ISIS militants had set the wells on fire hoping to obscure the view of Iraqi and coalition warplanes".

The usual view from space: RGB(b2-b3-b4)

четверг, 20 октября 2016 г.

Examples of VANE Language: RGB


One of the simplest operations is to generate RGB map. Here an image consists of Bands 4-3-2 which correspond to the well-known RGB color model. Red, green and blue spectra combine together for creation of full color images.

http://owm.io/beautiful-vane

среда, 12 октября 2016 г.

Financial impact of changing climate on agriculture


Recent years agriculture experiences much heavier losses caused by changing climate and alterations in global middle-season temperature. Even a small rise or drop of usual temperature takes a toll on yield, productivity and profitability of agricultural sector. In such situations both manufacturers and consumers of products undergo some difficulties.  
Profit and losses of manufacturers and consumers differ significantly depending on their location; mostly this burden comes to developing countries since they have much dependence on yield productivity and it’s more difficult for them to adopt changes.    
Dense population in the regions whose economics are in direct correlation with agricultural productivity, low income, lack of social protection, and limited opportunities of risk management – all these factors make the consequences of climatic change really devastating: thousands of people can lose their livelihoods, and the threat of famine for the whole countries is no longer the illusory in the coming decades.
However it would be a big mistake to consider that this disaster can happen only to agrarian countries. Shortage of crop can affect the entire agricultural supply chain and bring substantial losses to companies and corporations throughout the world:
  • bulk companies may not be able to use its infrastructure to the full capacity, as a result, they will be likely to face a reduction in operating income, and in severe cases, they will be unable to cover their fixed costs;
  • providers of logistics services may be unable to generate enough revenue to cover their fixed costs;
  • manufacturers may get non-fulfillment of sale contracts in a supply chain since they cannot provide previously agreed amount of agricultural products, and as a result, traders will have to purchase additional amount of  products at market prices;
  • due to a drop in sale volume manufacturers of agricultural equipment may suffer as  agricultural manufacturers cannot afford to invest in more modern technologies.  
And as an overall result, the majority of costs have to be covered by ordinary consumers who will have to pay more for food basket.

Examples of VANE Language: Fire detection


Detect areas that were deforested after fire by simple coding of burn index and apply it to chosen area and data of events. You can easily compare images before and after fire by getting visual result immediately.
http://owm.io/beautiful-vane

вторник, 11 октября 2016 г.

OpenWeatherMap presents the release of the VANE Language service

OpenWeatherMap presents the release of a new service the VANE Language (former imagery API) with examples: http://owm.io/vaneLanguage 
 Initially, we called it Imagery API but finally understood that this service is much bigger than just API calls. Language is a proper name for this service. It is like an SQL for satellite images. Something unique on the satellite market.The Language is entirely online service, there is no any manual procedures or presets like maps prepared in advance. One image that we receive from Landsat8 is not an image in common understanding but several layers that have to be processed and merged somehow before you can do anything with it. The weight of each unarchived number of bands is around 2 Gb, and obviously, it takes a lot of resources and time to process it. E.g to make a global map you need around 10,000 images that should be processed and merged. With VANE Language developer does not worry about time-costly pre-processing because we do it online immediately. We give him a powerful tool that is familiar to any developer and hides all complexity. In a short word VANE Language gives a full flexibility for a developer to do with images whatever they want and deploy result into applications. VANE also have a unique feature of configuring the formula of image processing. Means that developer can set up his logic of processing of the image to make specific vegetation indexes, false colors and any other images that he can use for analysis of objects, changes, yield health, etc.

понедельник, 3 октября 2016 г.

Modern approach to use of weather data in effective marketing


Recently the approach to marketing has greatly changed. Simple broadcasting of information about goods and services, even in the most whimsical of forms, is getting out-of-date quickly. At the moment those companies are the most successful who experience a flexible approach towards using of information, both current and historical.
Defining a target audience is only the first step. The aim here is to understand where your consumers are, what they do during different seasons and times of the day and what probably they are going to do in the future.
The use of information about a person in his real-time contextual surroundings lets provide content exactly in that moment when the content is of the most importance and it works more effective.
Such factor as weather is the most available and universal in consumers’ decision making process regarding goods and services. Weather influences where we go, what we wear, what we eat and the most important how we feel. The theme of weather is so all-around and discussed at many levels, it’s a great way to start a conversation in a company of unfamiliar people.  
Properly speaking, weather data is practically the only set of data available for marketers in real time mode that gives a notion about consumers’ mood, their desires and intentions to purchase something at the moment or in the future.
The fact that demand for products and services is determined by weather conditions significantly has been well-known for a long time already and it is actively used, for example, in contextual advertising. However, as researches and sales practices demonstrate, the aim of more effective communication with consumer requires taking into consideration many additional factors such as dwelling location, seasons and current seasonal deviations from norms, etc.  
Basically, having weather data with this necessary additional information, marketing specialists can tune to psyche of consumer and suggest him goods in that moment when he is ripe for purchase. And the story here goes more complex and interesting than notorious umbrellas and popsicles. One should also consider such factors as local traditions, for instance, at what temperature people make picnics outside, since depending on local habits people of different climate zones can buy air conditioners or warm clothes at the same temperature. And what’s more interesting is how weather influences mood of people and their intention to purchase. It is true not only for interest in some specific products, but for overall purchasing activity.
It was proved that exposure to sunlight increases willingness to spend money on products approximately twice. Negative mood depending on bad weather can make consumers react more effectively to negative advertising messages basing, for example, on fears. This method is used by the American Dental Association which experiences that on gloomy days negative advertisements have more sale response than traditional positive ads depicting healthy teeth and beaming smiles.
All above mentioned facts show that weather data is a perfect tool for targeted advertising.
With creative approach from marketer side the use of weather data provides a truly unique opportunity for successful communication with consumers.
This is true not only for current data, but also for short- and long-term forecasts that help in decision making about expanding or changing a range of products or services. And the analysis of historical data from the point of view of consumers’ reaction to seasonal deviations and climate change is very useful in planning of future prices.

понедельник, 5 сентября 2016 г.

Management of power consumption basing on weather data and forecast.


The electric power industry is likely to be the most weather sensitive sector in the world modern industry. Insurance against the risk of loss caused by  natural fluctuations in weather condition has become a usual practice at the end of the last century.
Nowadays, due to the planet’s growing population the question of regulation of power consumption is started to increase its significance.
Weather risk insurance contributes to the steady economic situation while energy saving and control of power consumption provide cost saving and slow down the wasting of energy resources that all in all help to reduce the negative impact on the ecology of the planet.
One of the modern approaches to the issue of energy saving is automatic management of station load which is based on current and expected levels of consumption which in its turn is closely connected with climatic and weather factors.
Combined heat and power plants, fossil-fuel power plants and other types of thermal power stations operate in accordance with current or temporary levels of power consumption and consider temperature and wind conditions of air masses. Hydropower plants totally depend on hydrological regime of rivers.
In the case of solar power plants energy flux density is contingent on intensity of solar radiation and as a result it is determined by a season, a part of a day and weather conditions.Wind farms  directly depend on direction, speed and power of wind. Here is also a crucial issue of strong geographical irregularity of distribution of wind energy.
At the moment exactly the wind energy sector is a good example of a sphere where automatic management of load and generation of electric power is realized basing on accurate weather forecast.
For instance, Xcel Energy company implemented a such project in October, 2011 and set a world record of the amount of energy generated from wind power.
"Our goal was to enable automatic management of load and generation [called “automatic dispatch], so our system could be smart about turning units on, or keeping them offline when using them would be inefficient or unnecessary. It’s enabled by an Its IT infrastructure that sends thousands of data points every five minutes in order to connect the system to real-time circumstances. The resulting cost savings were (and are) passed on to its customers, to date yielding approximately $60 million in savings for a company investment of $3.8 million. ”
http://www.forbes.com/sites/jonathansalembaskin/2016/06/30/xcel-tames-variability-of-wind-power/#43f16be42716

пятница, 26 августа 2016 г.

Weather risk management in retail


Daily news mass media readily inform people about numerous natural disasters happening throughout the world. Such extreme weather conditions as floods in India and Louisiana, severe drought in California paralyze the life of entire states and have a harmful impact on the economy.

According to Allianz Global Corporate & Specialty SE reports, only during the last three years insurers around the world paid $70 billion a year for claims related to extreme natural phenomena. In the 1980s the annual amount of payments for such claims consisted only $15 billion. By comparison, 905 natural disasters took place around the world in 2012, 93% of which were weather related ones, and they led to losses in the amount of $170 billion.

However, also less devastating in its power weather conditions have a strong impact on the economy. Furthermore, the losses emerging due to weather changes exceed the annual losses from natural disasters significantly. Even small deviations from the expected weather conditions can greatly affect the financial situation in various industries.

Retail industry is highly susceptible to risk of unstable weather. Abrupt change in the ordinary climatic conditions, such as sharp cooling or warming often turns for business into bigger losses than ones from the most serious natural disasters. For instance, an unusually mild winter provokes a drop in demand for warm clothing, and vice versa in cold summers demand for beach accessories and refreshments also falls. Excessive precipitation during weekends can result in people’s reluctance to leave their houses. Sudden pressure fluctuations negatively influence the well-being of customers who are weather dependent, and this fact can greatly affect the attendance of shops and shopping centers even in visually good weather.

Nowadays there exist solutions for weather risk management which can protect retailing companies from revenue fall in various cases when shopping centers are empty due to bad weather or in situations when demand for seasonal items is different from expected. The fact is that over the past few years the availability of weather data has increased significantly. Processing of huge amounts of data does not take a lot of time and has become much cheaper. Moreover, in modern conditions one can measure and analyze not only the basic weather parameters such as temperature, humidity, wind force and wind direction, but also intensity of rain, sunshine or snowfall. 

Modern technologies allow getting information on the current weather and providing accurate forecast not only for cities, but also for a specified place worldwide. Comparing the historical weather data with the statistics of growth and decline in demand for certain products, it is possible to anticipate the consumer involvement and to hedge weather risks in advance. Weather risk management gives opportunity for companies to perform their strategies such as diversification and adaptation of production for expected weather conditions.

среда, 17 августа 2016 г.

Weather risk management in the electrical power industry


Risk management is an opportunity to prevent risk emergence, as well as to mitigate negative effects of different adverse situations. Weather risk is related to physical phenomena which can influence performance of a company and which cannot be controlled from company's side.

One of the industries which is mostly sensitive to weather activity is the electrical power industry.
Basically the market of insurance of weather risk was initially established for purposes of the electrical power industry. Presupposition for this establishment appeared in the mid 90s when deregulation of the energy and urban engineering industries took place. And later on the impetus for emergence of this market was unusually warm winter 1997/98 which was caused by a natural phenomenon of El Niño.

That winter many energy companies of North America experienced heavy losses due to a sharp fall in energy consumption by urban and rural populations. Since that time for insurance against risk of loss due to natural variability of weather the instrument of weather futures has been created. Nowadays for this purpose as basis asset the historical data on main parameters (temperature, wind speed, precipitation) in a specified region is applied. Modern technologies such as digital cloud storages and Big Data allow storing huge array data structures and processing them quickly and provide easy access to necessary information of any time period for any world point.