There is a source at http://agromonitoring.com where we suggest several simple examples of what you can create in your application with the help of our weather data.
For each of polygons/fields ( how to draw a polygon with visual tools ) you can set graphical presentation of climatic parameters, for instance, as charts for 3-hour forecasts for 5 days ahead and daily forecasts for 14 days ahead.
At the moment there are only temperature data in the application, but our weather API provides any data on pressure, clouds, wind, temperature, max/min temperature etc.
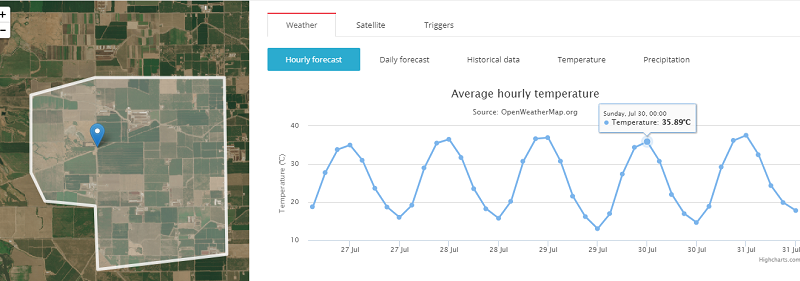
3-hour forecast for 5 days ahead
Visual presentation of historical data for a single field.
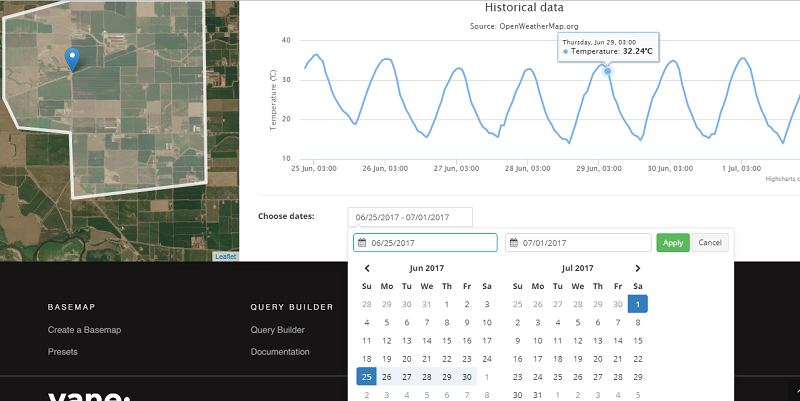
In this example the historical data are limited by a week period, but using our historical data API you can get them for any period for the last 5 years (check http://openweathermap.org/price)
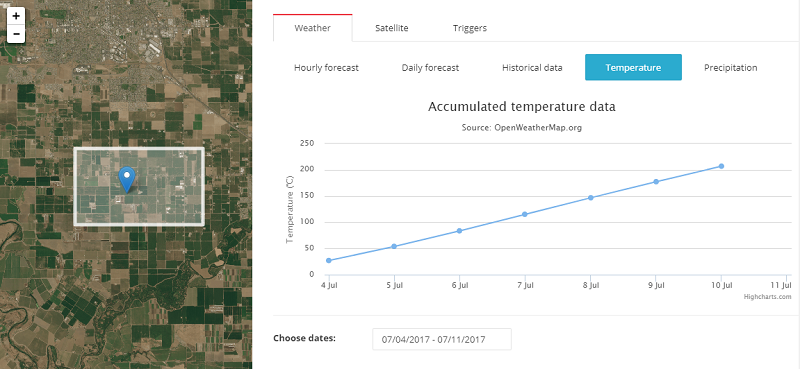
Accumulated parameters.
These graphs show a sum of accumulated precipitation and accumulated temperatures.
Accumulated temperature data is an index that denotes an amount of warm. This index is determined as a sum of average daily air and soil temperatures which exceeds a definite threshold of 0, 5, 10 degrees or a biological minimum of temperature level which is crucial for some specific plant.
Accumulated temperature data is an index that denotes an amount of warm. This index is determined as a sum of average daily air and soil temperatures which exceeds a definite threshold of 0, 5, 10 degrees or a biological minimum of temperature level which is crucial for some specific plant.
Accumulated precipitation data is calculated as a sum of all parameters for a peculiar period.
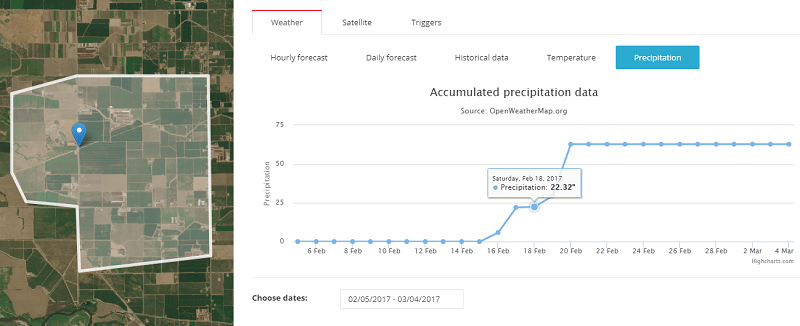
Now this data is available only at agromonitoring.com and is calculated basing on our historical data.
Soon we plan to launch new APIs that will provide already calculated values of accumulated indexes for a definite region.
Soon we plan to launch new APIs that will provide already calculated values of accumulated indexes for a definite region.
Комментариев нет:
Отправить комментарий