The product we are launching today continues our freemium strategy — Global Base Map. It’s available as a part of VANE platform and opens the easiest way to start working with satellite imagery and connect it to your own application.
You can choose from a number of presets that provides imagery in a way most fitting for your project. And as a result you get the tile URL to connect maps to your client apps with the instant access.
Get your #satmap at owm.io/sat
The product remains free for open satellite imagery and will be extended with commercial satellites with higher resolution and cadence.
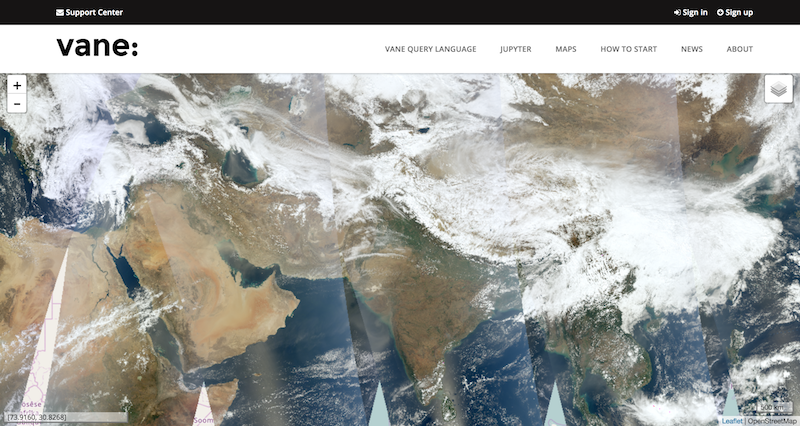
The free for all “VANE Global Map” constituted of middle resolution Landsat and Sentinel imagery — still continuously updated as new imagery become available. To make a global mosaic we applied special color processing algorithms for both of the imagery data sets, thus it can be used in one single layer as opposed to Landsat-only or Sentinel-only mosaics.
And for low-zoom levels (1–5) — to observe Earth on a daily or hourly time basis — we added low resolution imagery from Aqua and Terra satellites that can be vividly combined with weather layers — previously we posted about this part of the work on our blog. We process MODIS imagery in minimum time as for Web Mercator based apps — which means you can get tiles directly in any popular mapping library from Google Maps to Leaflet. The delay between satellite overpass and the publishing on our server is about 2 hours, yet we look forward to reducing this time. About every 30 minutes new imagery comes from each of satellites.
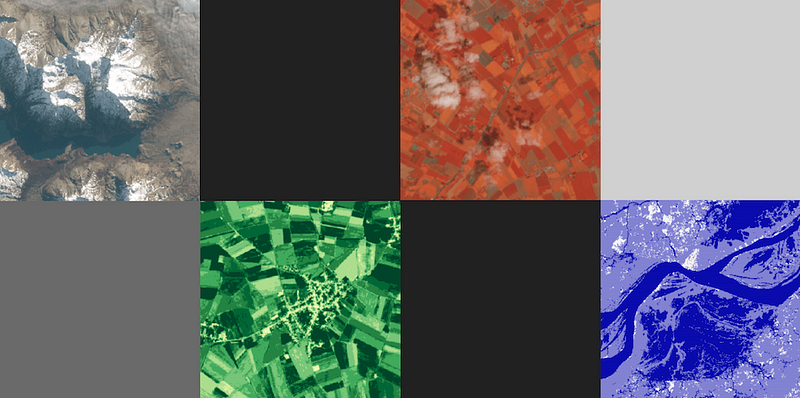
What could be even more fascinating about Global Satellite Map — you get it not only in one RGB state (as we get used to browsing on web-mapping services) or not only in the provided number of presets but with all capabilities that are brought to you by the power of VANE Language — select, combine, apply color processing and more.
All operations you can do with imagery online including applying your own analytcs algorithms and raster calculation formulas — this is the next step we are looking forward to move to, meanwhile you can learn some of these advanced functionality from JUPYTER based examples.
For now developers of Smart Farming applications can get a vegetation map (so called NDVI) from the same base map and calculate NDVI values to detect the amount and healthiness of a vegetation and compare its dynamics for the certain area of interest.
Комментариев нет:
Отправить комментарий