As a part of the Global Base Map plan, an easier way to start to work with satellite imagery and services provided by VANE platform, we have added low resolution imagery from Aqua and Terra satellites (aka MODIS). This kind of imagery enables Earth observation on a daily and hourly time basis and can be vividly combined with weather layers (previously we’ve posted about this part of the work on our blog). The delay between satellite overpasses and publication of the imagery is about 2 hours, this is the minimum time delay for Web Mercator version of this kind of satellite imagery, yet we look forward to reducing this time. About every 30 minutes new imagery comes from each of satellites.
Personally, I’m a big fan of NASA GIBS MODIS — where one can browse and download nearly all the products that can be generated based on MODIS imagery. But those who use this service as a real-time API, as I did, know the issue with the time delay and transparency (due to synchronization issue of the “no-data” layer). That’s why we decided to process low level data for Global Base Map.
In the sample image below showing the comparison of VANE and NASA GIBS layers as for Terra satellite, the divider’s bar defines the time difference between one and the other, which is about 3–4 satellite passes for mercator projection and 1–2 for latlon which is the default projection for Worldview. Also there is some issue to use GIBS layer with a transparent background to overlay it on base maps. You can check this example live at http://owm.io/cases/test-modis and you can get the both of the layers at http://owm.io/modis
THE COMPARISON OF VANE AND NASA GIBS LAYERS AS FOR TERRA SATELLITE IN WEB-MERCATOR PROJECTION
Next step we are going to bind this layers in one single mosaic to add it to “Weathermap” application where it can be combined with weather layers and to provide it through VANE API for everyone. (Stay tuned to know about “Open Satellite map” that’s coming pretty soon.)
To start using these maps from third-party applications and to get tiles from server you have to generate an API key under your personal Openweathermap account — thus users can use it in a vast range of clients from GIS desktops to web-mapping libraries (see more detailed description and examples). You can sign in under your Openweathermap account or create a new one.
OPERATIVE TERRA IMAGERY FOR THE CURRENT DATE (13 MARCH) COMBINED WITH PRECIPITATION LAYER — BOTH LAYERS ARE GENERATED ON THE TOP OF VANE PLATFORM
The traditional market of satellite imagery products is something not easy to communicate with. You have to deeply immerse yourself in the subject of geospatial andremote sensingto realize what kind of products you could get and how it could be used in your particular application. Besides Google Maps and this kind of horizontal platforms, where the satellite images are a part of the map services, there are financial and technological barriers that hold back the market of satellite imagery products being accepted by mass market applications and services developers.
When the satellite market is growing due to amicrosatellitetechnical revolution and appearance of the new private companies (over 1.500 satellites are expected to be launched before 2024), we see more open data, like ESA’s Copernicus program, became available — the cost barriers are going to be less challenging. The goal of VANE™ platform is to remove the technological barriers for application developers and education.
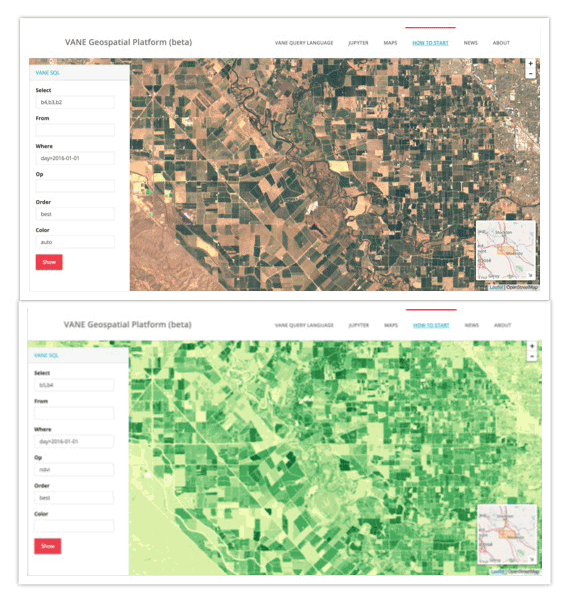
VANE Query Language for intuitive queries to the data, getting it instantly into application
The SQL fashioned VANE Language concept is to unite all operations with satellite data, like processing and delivery, in one single query.
The typical workflow for satellite product — which means the one for appropriate location and data period — looks like the following:
go to a catalog of satellite imagery (for free and publicly available Landsat imagery, one ishttps://earthexplorer.usgs.gov/, povided by US geological survey)
search by predefined criteria manually or through the API, if provided, in order to get the imagery list (the number of scene ID’s) and the metadata
download so called Level1 products (in terms of pre-processing, usually in GeoTiff format) by selected ID’s NB! Concerning Landsat — after Amazon launched their Landsat on AWS, it’s become more usable to download products by specific bands. At “Openweathermap” we also use Amazon cloud services but as one of the data sources to download Landsat data
then you come to data processing either it’s a simple RGB synthesis or an operation to calculate some values like NDVI (vegetation index). Typically for that kind of tasks the data processing software is necessary — usually representing the powerful packages that are superfluous for such kind of operations (not to say too expensive)
finalize your workflow by preparing your products for Web — which means transformation into Mercator projection, tiling and uploading to some web server or deploying your products using one of commercial or opensource geo servers software through WMS / TMS export protocols
In VANE Language the workflow mentioned above might look somehow like this:
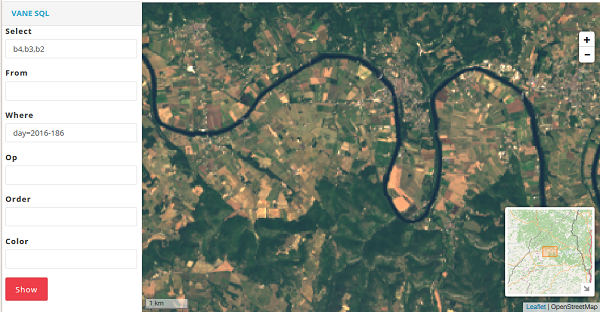
Moreover you can build queries and check them online getting instant visual result with the help of VANE visual tools like SQL-viewer.
What does it promise for now (or for the near future)?
No catalogs:
The one of the ideas of the VANE platform — no need of search by scenes and footprints. It is based on a simple assumption: each location in the world has metadata — click on any location and get information about all pixels containing this location. Such projects as cloudless atlases and Google base satellite maps are created according to this basic principle, stitching best imagery pixels in one seamless mosaic. According to scenes metadata VANE can preliminary compile the best satellite cover — users need to set up a parameter order=best for this operation. Even more, VANE language allows you to set up further requirements for your mosaic, providing appropriate parameters in your query — meaning: no older than (day>{yyyy-mm-dd})… or put all last imagery on the top (order=last)… or within the specific time interval (between({yyyy-mm-dd}:{yyyy-mm-dd}))…
Than you can go further, applying your custom colors to the result mosaic, according to VANE languagespecification.
No desktop:
Although for deep analysis of satellite images and processing it for expert work, like seamless and tonal-balanced satellite mosaic or training algorithms for change detection, you do need some software and packages, yet most of the typical tasks and algorithms you can apply online. And this is the trend of BigData and SaaS that could hardly being stopped by GIS software vendors.
One query:
With the VANE query language developer sets up all parameters in one query:
what kind of data he needs (satellite imagery, weather, sensors)
applied processing methods (RGB, NDVI, false colors; any other indices, band combination, custom color scheme etc.)
<a result format> (map, tile, JSON data feed etc.)
VANE analytical tools for online computing and data processing
For such kind of applications and exercises we’ve deployed JUPYTER programming environment with the VANE language implementation. Jupyter Notebook is a popular open and free tool on Python that combines code, text, and charts, and provides you with the possibility to distribute results to other users. With Jupyter you can play with VANE data such as weather and satellite images and their combination. It is an ultimately convenient tool for data science, experiments with math algorithms and data processing. And of course for education.
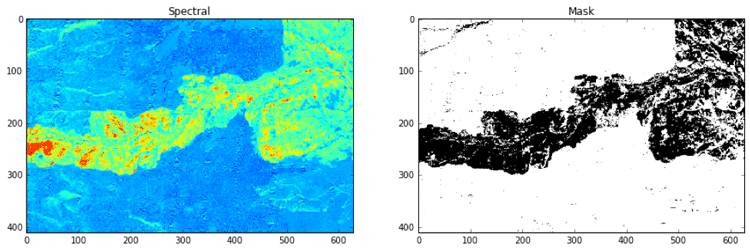
Now we can get closer to analytical tasks like change detection — one of the very base for analysis on satellite imagery. This particular example shows how to apply Normalized Burn Ratio Index (NBR) to Landsat to detect wildfire burning footprint for the chosen area.
As a result of the exercise you will get a calculated area of burnt land as a resulting difference between two images.
Launching Jupyter on VANE platform under your Openweathermap account you will find all examples in the subdirectory and will be able to create your notebooks for experimental and research tasks with the immediate results that you can later download as a ready-to-publish material or share with your colleagues.
The world around us is changing constantly. Technologies develop, progress takes its place. However, one thing stays permanent: humans still depend on environment. And partially well-being of people is related to plants. Plants allow people to breathe, plants give us food, shelter, medicaments and many other crucial things. Yet, uncontrolled agriculture, transition to monoculture farming within entire countries, climate change — all these factors have negative effect on vegetation layer. Moreover, human population grows exponentially, and the issue of food supply arises more sharply.
That’s why nowadays there is a steady tendency to preserve what we possess at the moment. And here satellite monitoring over vegetation condition comes to help. Also satellite monitoring facilitates work of farmers and lets decrease costs and losses in case of negative weather phenomena such as floods and drought. Whenever it is anemergency situationorfarming planningthere is a great helping tool that is satellite imagery which provides a vegetation index (NDVI) and a water index (NDWI).
Let’s consider what they are and how they differentiate.
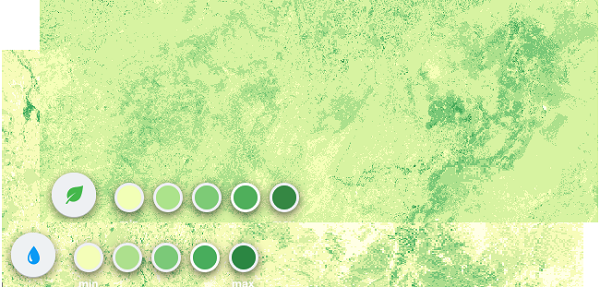
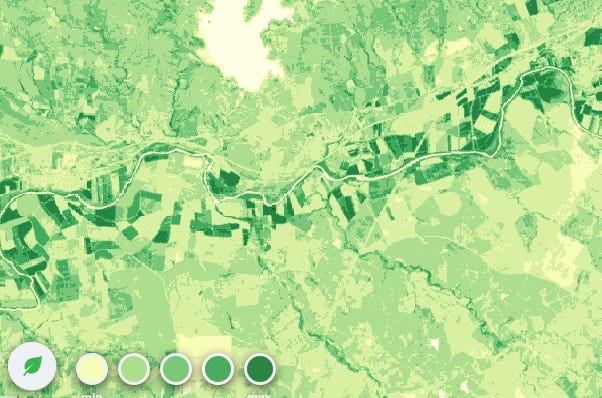
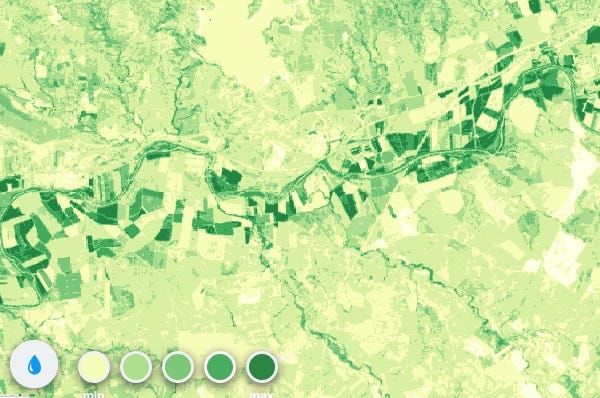
NDVI — Normalized Difference Vegetation Index
NDVI index on the satellite image
Nowadays it is the most common index of density of vegetation layer. Low values of NDVI (0.1 and less) correspond to vegetation free regions and to stone, sand and snow areas. Moderate index values (0.2–0.3) show presence of bush and meadow vegetation; while high index values (0.6–0.8) denote forests of temperate climate and tropical rainforests.
NDVI is calculated from comparison of visible and near-infrared light reflected from vegetation. A green pigment in leaves that is chlorophyll greatly absorbs visible light (from 0.4 to 0.7 microns) for photosynthesis process. At the same time, structure of cells of leaves greatly reflects near-infrared light (from 0.7 to 1.1 microns). Healthy vegetation absorbs a major part of visible light while it also reflects a larger part of near-infrared light. Unhealthy or scarce vegetation reflects visible light mostly and a lesser part of near-infrared light.
NDVI = (NIR — VIS) / (NIR + VIS)
NDWI Normalized Difference Water Index
NDWI index on the satellite image
Plant humidity is an important indicator forwildfiresmonitoring and for defining of possibly dangerous regions. Low humidity contributes to environment susceptible to wild fires, especially it happens in ecosystems where live and dry vegetation coexist.
NDWI in comparison with NDVI is more accurate indicator of plant humidity. NDWI is calculated with the help of water absorption band which is more closely connected with moisture than chlorophyll whose light-absorbing properties are used in calculation of NDVI. During droughts vegetation condition greatly depends on water stress and in this case Normalized Difference Water Index is more useful than chlorophyll-based Normalized Difference Vegetation Index.
The one of the ideas of VANE platform — no
need of search by scenes and footprints. It is based on a simple
assumption: each location in the world has metadata — click on any
location and get information about all pixels containing this location.
Such projects as cloudless atlases and Google base satellite maps are
created according to this basic principle, stitching best imagery pixels
in one seamless mosaic. According to scenes metadata VANE can preliminary compile the best satellite cover — users need to set up a parameter order=best for this operation. Even more, VANE language
allows you to set up further requirements for your mosaic, providing
appropriate parameters in your query — meaning: no older than
(day>{yyyy-mm-dd})… or put all last imagery on the top (order=last)…
or within the specific time interval
(between({yyyy-mm-dd}:{yyyy-mm-dd}))…
Than you can go further, applying your custom colors to the result mosaic, according to VANE languagespecification.
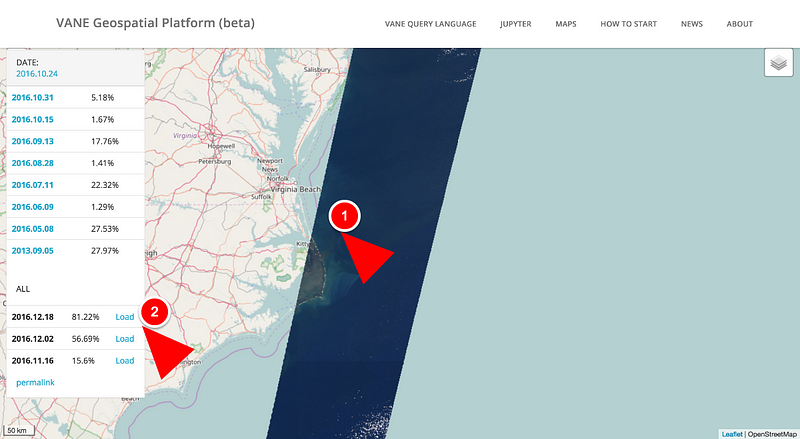
Just to demonstrate this principle in work we’ve launched a very basic application calledFinder.
How it works:
You can follow these particular steps:
Click any location on the map to get the list of VANE imagery available for this location. All imagery already processed is listed on the top
Whether
there is an imagery that has not been processed yet — you can preview
the metadata and the quicklook (here we go to the classic catalog
workflow) and start the processing by clicking the Load button.
It takes from 10 to 50 minutes for the new image being uploaded and processed.
Don’t hesitate to send us your comments on using the Finder and the VANE platform — we
appreciate feedback and look forward to hearing about your particular
cases and ideas on using satellite imagery and environmental data.
In
the current version of VANE Language, we use images from Landsat8
satellite which captures the Earth’s entire surface every 16 days. The
satellite makes hundreds of images with a unique name for each one like
LC81410552016219LGN00 and a pixel size of 30 meters, each image consists
of 11 bands, the size of the uncompressed image is 2 GB.
Landsat 8 Operational Land Imager (OLI) and Thermal Infrared Sensor (TIRS)
images consist of nine spectral bands with a spatial resolution of 30
meters for Bands 1 to 7 and 9. New Band 1 (ultra-blue) is useful for
coastal and aerosol studies, and also new Band 9 is applicable for
cirrus cloud detection. The resolution of Band 8 (panchromatic) is 15
meters. Thermal Bands 10 and 11 provide more accurate surface
temperatures and are collected at 100 meters. Approximate scene size is
170 km north-south by 183 km east-west (106 mi by 114 mi). By default, we get B2, B3, B4, B5, B7, but it is possible to download any other bands.
Landsat 8 Operational Land Imager (OLI) and Thermal Infrared Sensor (TIRS) Launched February 11, 2013
Band
1 — Coastal aerosol, Band 2 — Blue, Band 3 — Green, Band 4 — Red, Band
5 — Near Infrared (NIR), Band 6 — SWIR, Band 7 — SWIR, Band
8 — Panchromatic, Band 9 — Cirrus, Band 10 — Thermal Infrared (TIRS),
Band 11 — Thermal Infrared (TIRS)
Let’s consider how these bands and their combinations can be used to visualize Landsat 8 images.
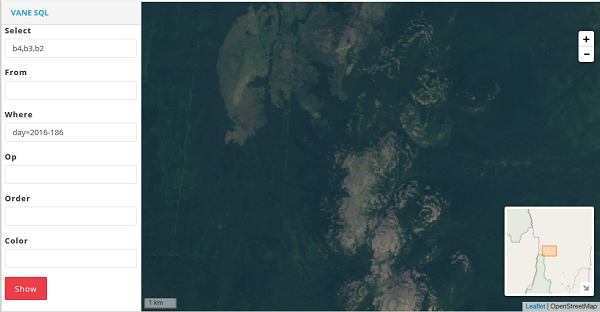
Bands 2, 3, and 4
Blue, green and red spectra combine together for creation of full color images. One
of the simplest operations is to generate RGB map. Here an image
consists of Bands 4–3–2 which correspond to the well-known RGB color
model.
Near
Infrared (NIR) — this part of the spectrum is one of the most
frequently used as healthy plants reflect it mostly: water in their
leaves scatters the wavelengths back into the sky. This information gets
useful for vegetation analysis. By matching this band with others, one
can get indexes like NDVI, which provide more precise measurement of
plant condition comparing with only looking at visible greenness.
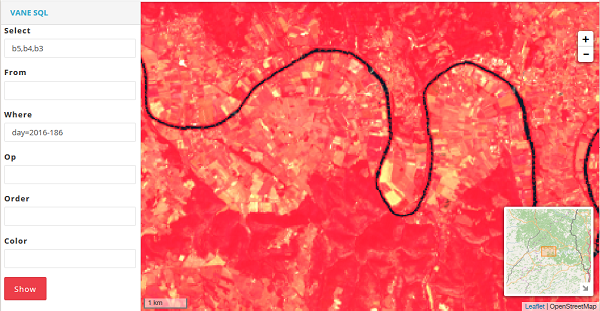
Let’s look at image #1 in the 5–4–3 band combination.
Pay
your attention how healthier vegetation beams in red more clearly. This
band combination is often used for remote sensing of agricultural,
forest and wetlands.
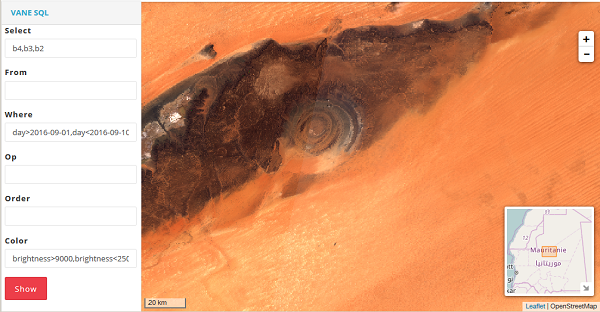
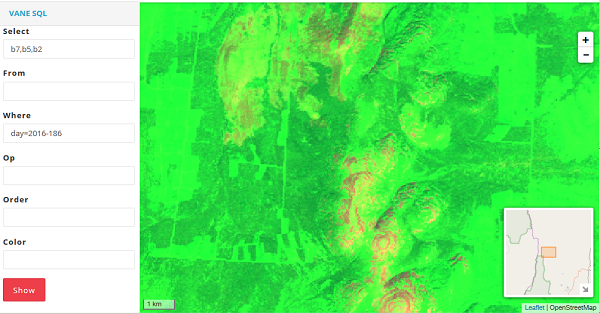
Bands 7 — The Shortwave Infrared (SWIR2)
Spectra
Shortwave Infrared let clearly distinguish wet soil from dry one, and
also differentiate the earth’s structure: rocks and soils that can look
almost similar in other bands have strong distinction in SWIR.
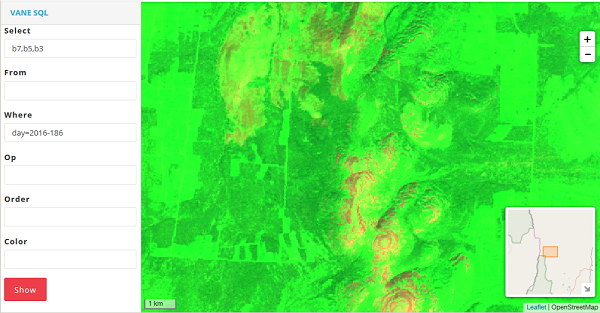
We get the following picture if we take image #2 and use infrared band 7 instead of red band 4.
This
band combination is convenient for the monitoring of agricultural crops
which are displayed in bright green color. Bare earth is showed in
purple color while not cultivated vegetation appears in subtle green.
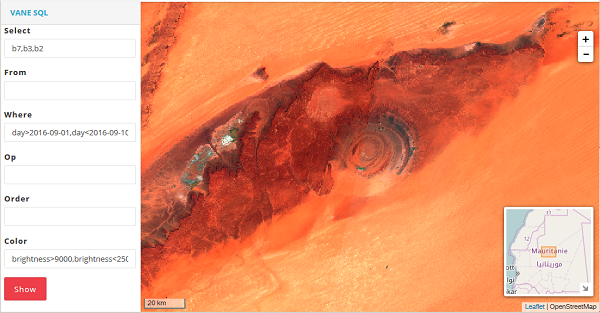
This
false color image shows land in orange and green colors, ice is
depicted in beaming purple, and water appears to be blue. This band
combination is similar to the 7–5–2 band combination, but the former
shows vegetation in more bright shades of green.
The NDVI, i.e. the normalized difference vegetation index, is a simple graphical indicator of biomass active photosynthetically.The NDVI is one of the most common and widely used indexes for evaluation of vegetated areas, their quality and quantity. Using the NDVI it is possible to detect presence of plants, its dynamics of emergence and growth. For getting of this index there is Band 5 which measures the near infrared spectrum, or NIR (Near Infrared). This part of the spectrum is reflected by water in leaves of healthy plants. Maps of the NDVI with dynamics (in various seasons) let tracing peculiar features and deviations of seasonal vegetation. http://owm.io/sql-viewer?select=b5,b4&where=day=2016-200&op=ndvi&lon=-102.21&lat=34.3264&zoom=12