вторник, 1 августа 2017 г.

UV radiation: Its influence on ecosystems. The tools for secure monitoring — API for UV-index


In recent years, the question of changes happening to a phenomenon of ultraviolet radiation at the earth’s surface attracts increasing attention. The influence of ultraviolet radiation on the life on the Earth is immense. It is enough saying that ultraviolet radiation is one of the most important factors for evolutionary progress of nearly all living creatures. Various ecosystems in their development process have adapted to a level of UV radiation to some extent anyway. Thus it is crucially important for successful functioning of these systems that the UV level stays within a specific range as its abrupt shift can lead to serious consequences, to negative ones and however sometimes to positive. These shifts take their toll on the all ecosystems such as vegetation, freshwater habitats and sees, and certainly they have a strong effect on human activity.

Plants do have the ability to recover, but when a received radiation dose exceeds their regeneration ability so then damage is inevitable. UV radiation damage becomes apparent in decreasing of crop yield and fertility, in lowering of quality of goods and in ecological aftermath such as the change of proportion of cultivated plants and weeds.

It’s also necessary to consider here that UV radiation reduces the wear resistance of materials employed for outdoor usage. Even a slight increase in the level of UV radiation drives to diminishing of a service life of external facilities and to rising of repair and replacement costs. Nowadays effective researches are conducted to register the influence of UV radiation on a human body, and that influence can be beneficial, and what’s more it’s essential for a regular vital activity, and it can be almost destroying for a lively creature.

Data on intensity of UV radiation is highly required recently. Particularly when speaking about substantial changes of climate which are happening now and which are obvious to any ordinary person without any sensitive measuring instruments.

That’s why there are currently in need the tools for secure monitoring and forecasting of these changes, for development of successful management of possible consequences and for reliable assessment of current and future context.

Fortunately, this tool really exists and has been in operation for some time already. Over the past few years, OpenWeatherMap company has provided a significant data volume on UV-index. We deliver UVI current data as well as daily forecasts for a period of 8 days for any locations. Also we have started accumulation of historical data actively.

Then recently we have greatly improved the quality of provided data, that’s our API for UV-index. For example, now there is a new feature to request data on any geographic coordinates without limits on accuracy.
Accuracy of UVI modeled data has been increased twice (the interpolation grid step decreased from 0.5 to 0.25 degrees).
Soon the support of search by city name, city id and zip-code will be available.
You can find the instructions here http://openweathermap.org/api/uvi

четверг, 27 июля 2017 г.

Model of climatic parameters calculation for single fields

There is a source at http://agromonitoring.com where we suggest several simple examples of what you can create in your application with the help of our weather data.
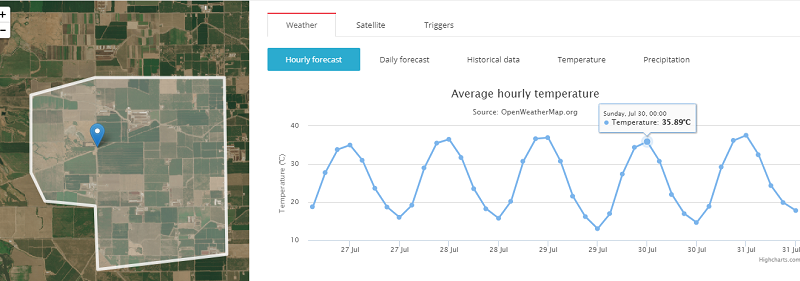
For each of polygons/fields ( how to draw a polygon with visual tools ) you can set graphical presentation of climatic parameters, for instance, as charts for 3-hour forecasts for 5 days ahead and daily forecasts for 14 days ahead.
At the moment there are only temperature data in the application, but our weather API provides any data on pressure, clouds, wind, temperature, max/min temperature etc.
3-hour forecast for 5 days ahead

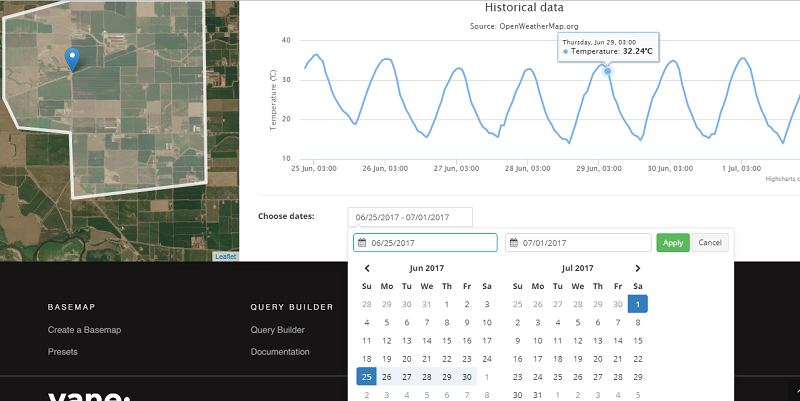
Visual presentation of historical data for a single field.

In this example the historical data are limited by a week period, but using our historical data API you can get them for any period for the last 5 years (check http://openweathermap.org/price)

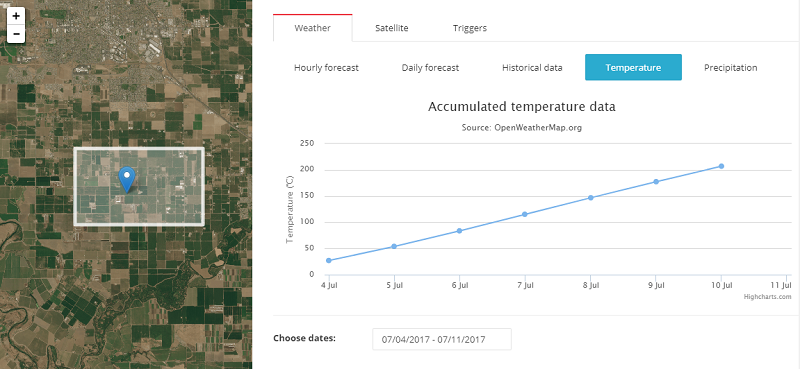
Accumulated parameters.
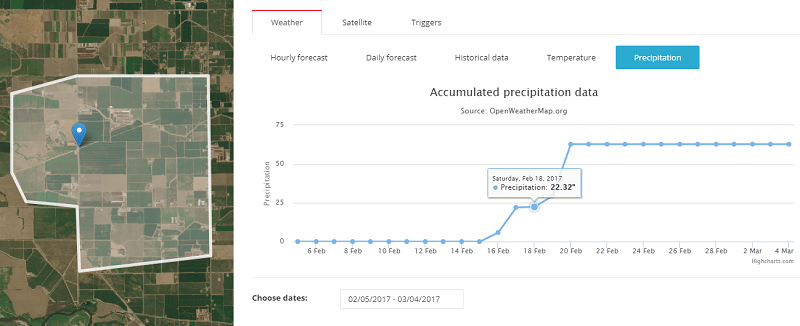
These graphs show a sum of accumulated precipitation and accumulated temperatures.
Accumulated temperature data is an index that denotes an amount of warm. This index is determined as a sum of average daily air and soil temperatures which exceeds a definite threshold of 0, 5, 10 degrees or a biological minimum of temperature level which is crucial for some specific plant.

Accumulated precipitation data is calculated as a sum of all parameters for a peculiar period.
Now this data is available only at agromonitoring.com and is calculated basing on our historical data.
Soon we plan to launch new APIs that will  provide already calculated values of accumulated indexes for a definite region.

The weather alerts on our meteorological data

The weather alerts are ones of the tools that we offer for agricultural monitoring of fields http://agromonitoring.com/. For your convenience we have designed an interface for our API where you can create triggers for a polygon of any shape. These triggers will work out in case of emergence of specified weather conditions (temperature, humidity, pressure, etc.) during a certain period of time.    
For example, there is a field where some plants are inclined to suffer from freezing, while other plants need measures to be taken in case of strong wind – and you can easily get this information with our tool. Just set specific trigger conditions and if they happen you will get a program warning.  
Four simple steps for working with Weather Triggers API:
1  Create an account in members area and receive a key to access API.
2  Name your field and draw a polygon with visual tools. 
 
3 Create the trigger with the necessary conditions for temperature, pressure, humidity, wind speed, wind direction and clouds.
Parameters description: 
The Start and the End fields define the time period.
These fields also contain nested structures describing the beginning and the end of a time interval which is used to check the conditions.
The beginning and the end of a time interval represent a set of instructions for dynamic timestamp estimation. Timestamp is calculated considering the current time at the moment when conditions are being checked.
Parameter
  Description
amount
  Number of milliseconds
expression
  Specifies how to process value of the amount field
 
The field Expression has three admissible values:
  • exact - the field amount will be interpreted as a timestamp indicating an exact date/time
  • аfter - the field amount will be interpreted as a number of milliseconds, which needs to be added to the current timestamp at the moment of validation to receive a chosen date/time.
  • before - the field amount will be interpreted as a number of milliseconds, which needs to be subtracted from the current timestamp at the moment of validation to receive a chosen date/time.

The field Сonditions contains an array of objects describing the parameters that are used to do the comparison.
Parameter
  Description
name
  The name of the parameter to be compared with
expression
  The expression, which will be used to compare
amount
  Numerical value to be compared with

In the field name the following values are allowed: temp, pressure, humidity, wind_speed, wind_direction, clouds. Value of the name field specifies the corresponding parameter in a response from the Weather API that will be compared with.
The field expression indicates how exactly to perform comparison. The following values are available:
$gt - more than a value specified in amount.
$lt - less than a value specified in amount.
$gte - greater than or equals to a value specified in amount.
$lte - less than or equals to a value specified in amount.
$eq - equals to a value specified in amount.
$ne - not equals to a value specified in amount.
4  Check our service and receive information about an occurrence or a forecast of the upcoming events, which you are interested in.

See further: 
API documentation for Weather Alerts http://openweathermap.org/triggers 
Weather Alerts structure -  http://openweathermap.org/triggers-struct

вторник, 18 июля 2017 г.

Open Dashboard for Agricultural Monitoring

Today we’d like to show you what you can do with our data. Open Dashboard for Agricultural Monitoring (http://agromonitoring.com/) is a presentation of possible use of weather and satellite data in your agriculture applications. This is a service where everyone can find weather data and satellite imagery of their fields easily through our APIs. All you need to do is just to register, to draw a polygon and you get all the necessary stuff in an instant.        
Here you can evaluate a condition of fields from satellite imagery and get clear information for analysis of the dynamic changes taking place on these fields. Also this service provides weather data for any specified area: forecasts, historical data and notifications about critical weather situations for a stated period.
Watch your fields with open weather data and satellite imagery.
Create your fields and use the full range of open services on weather and satellite imagery
Field shape:
  • Draw a polygon with visual tools.
Weather:
  • 3-hour forecast for 5 days ahead
  • Daily forecast for 14 days ahead
  • Historical weather for 1 week past
  • Accumulated parameters (for accumulated temperature and precipitation the historical data should be customized)
Vegetation indexes:
  • NDVI on Landsat 8 and Sentinel 2
Build alerts on weather parameters:
 -  Weather triggers that flash on in case of the selected weather conditions (temperature, humidity, pressure, etc.) happening in a specified period of time. For example, you are interested in the forthcoming frosts or the probability of a wind speed increase in a certain place.

вторник, 4 июля 2017 г.

We are happy to announce that one of our products — API for UV-index has got significant improvement

We are happy to announce that one of our products — API for UV-index has got significant improvement.
- Now besides current and historical data, you can also get UVI forecasts for periods of 8 days.
- Syntax has got considerably easier, it has become clearer and more unified like other APIs version 2.5.
- There is a new feature to request data on any geographic coordinates without limits on accuracy.
- Accuracy of UVI modeled data has been increased twice (the interpolation grid step decreased from 0.5 to 0.25 degrees).
- Soon the support of search by city name, city id and zip-code will be available.
You can find the instructions for the updated version here http://openweathermap.org/api/uvi
Please pay attention that during 2 weeks UV-index data will be in open access. Further, access to this data will be available only for paid plans starting from Developer. For more information on our plans please visit http://openweathermap.org/price
The previous version of API (http://openweathermap.org/api/old-uvi) will be announced deprecated soon, and no support will be provided for this version.

We are glad to introduce a new version of our satellite image processing platform VANE

We are glad to introduce a new version of our satellite image processing platform VANE.
So, what’s new:
Now a request with an error or invalid values will return a response with the recommendations on how to fix it. Also the validation of values became stricter. For example, the “select” parameter takes only a definite amount of bands. Parameters’ specifications themselves have gone through some changes
You can find  the detailed description here http://owm.io/vaneLanguage.
It’s easier to work with colors now by using default color schemes and palettes. A corresponding default color palette is automatically generated depending on an operation (the “op” parameter) and a current data source (the “from” parameter). And of course you can make your own color scheme.

VANE Global Base Map


The product we are launching today continues our freemium strategy — Global Base Map. It’s available as a part of VANE platform and opens the easiest way to start working with satellite imagery and connect it to your own application.
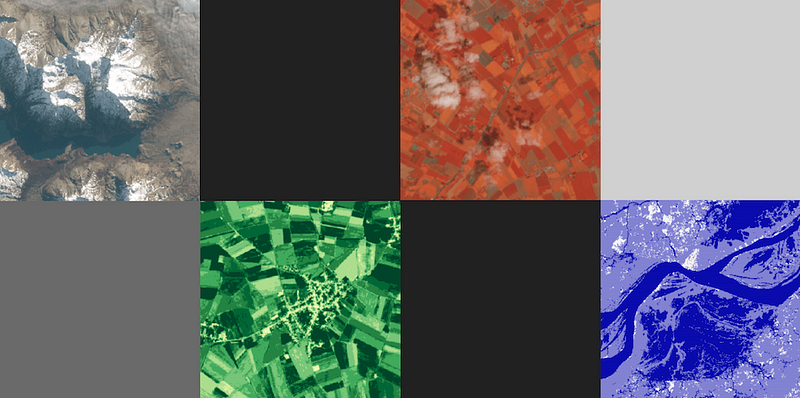
You can choose from a number of presets that provides imagery in a way most fitting for your project. And as a result you get the tile URL to connect maps to your client apps with the instant access.
Get your #satmap at owm.io/sat
The product remains free for open satellite imagery and will be extended with commercial satellites with higher resolution and cadence.
The free for all “VANE Global Map” constituted of middle resolution Landsat and Sentinel imagery — still continuously updated as new imagery become available. To make a global mosaic we applied special color processing algorithms for both of the imagery data sets, thus it can be used in one single layer as opposed to Landsat-only or Sentinel-only mosaics.
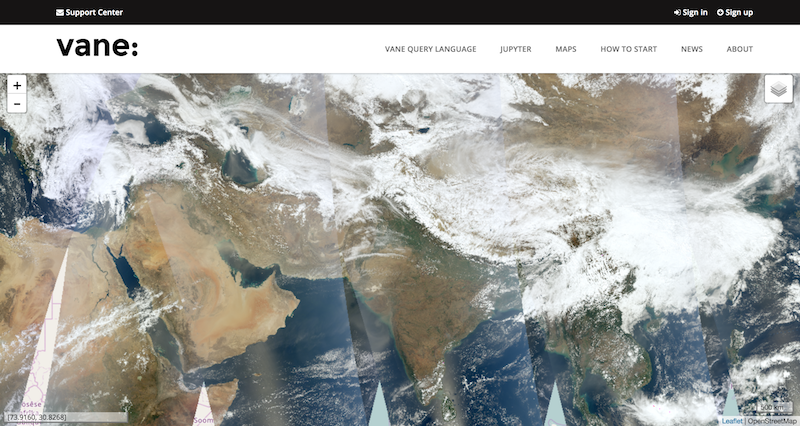
And for low-zoom levels (1–5) — to observe Earth on a daily or hourly time basis — we added low resolution imagery from Aqua and Terra satellites that can be vividly combined with weather layers — previously we posted about this part of the work on our blog. We process MODIS imagery in minimum time as for Web Mercator based apps — which means you can get tiles directly in any popular mapping library from Google Maps to Leaflet. The delay between satellite overpass and the publishing on our server is about 2 hours, yet we look forward to reducing this time. About every 30 minutes new imagery comes from each of satellites.
MODIS — Aqua and Terra layers on the Global Base Map powered by VANE platform
What could be even more fascinating about Global Satellite Map — you get it not only in one RGB state (as we get used to browsing on web-mapping services) or not only in the provided number of presets but with all capabilities that are brought to you by the power of VANE Language — select, combine, apply color processing and more.
All operations you can do with imagery online including applying your own analytcs algorithms and raster calculation formulas — this is the next step we are looking forward to move to, meanwhile you can learn some of these advanced functionality from JUPYTER based examples.
For now developers of Smart Farming applications can get a vegetation map (so called NDVI) from the same base map and calculate NDVI values to detect the amount and healthiness of a vegetation and compare its dynamics for the certain area of interest.